Free Access
Fig. 6
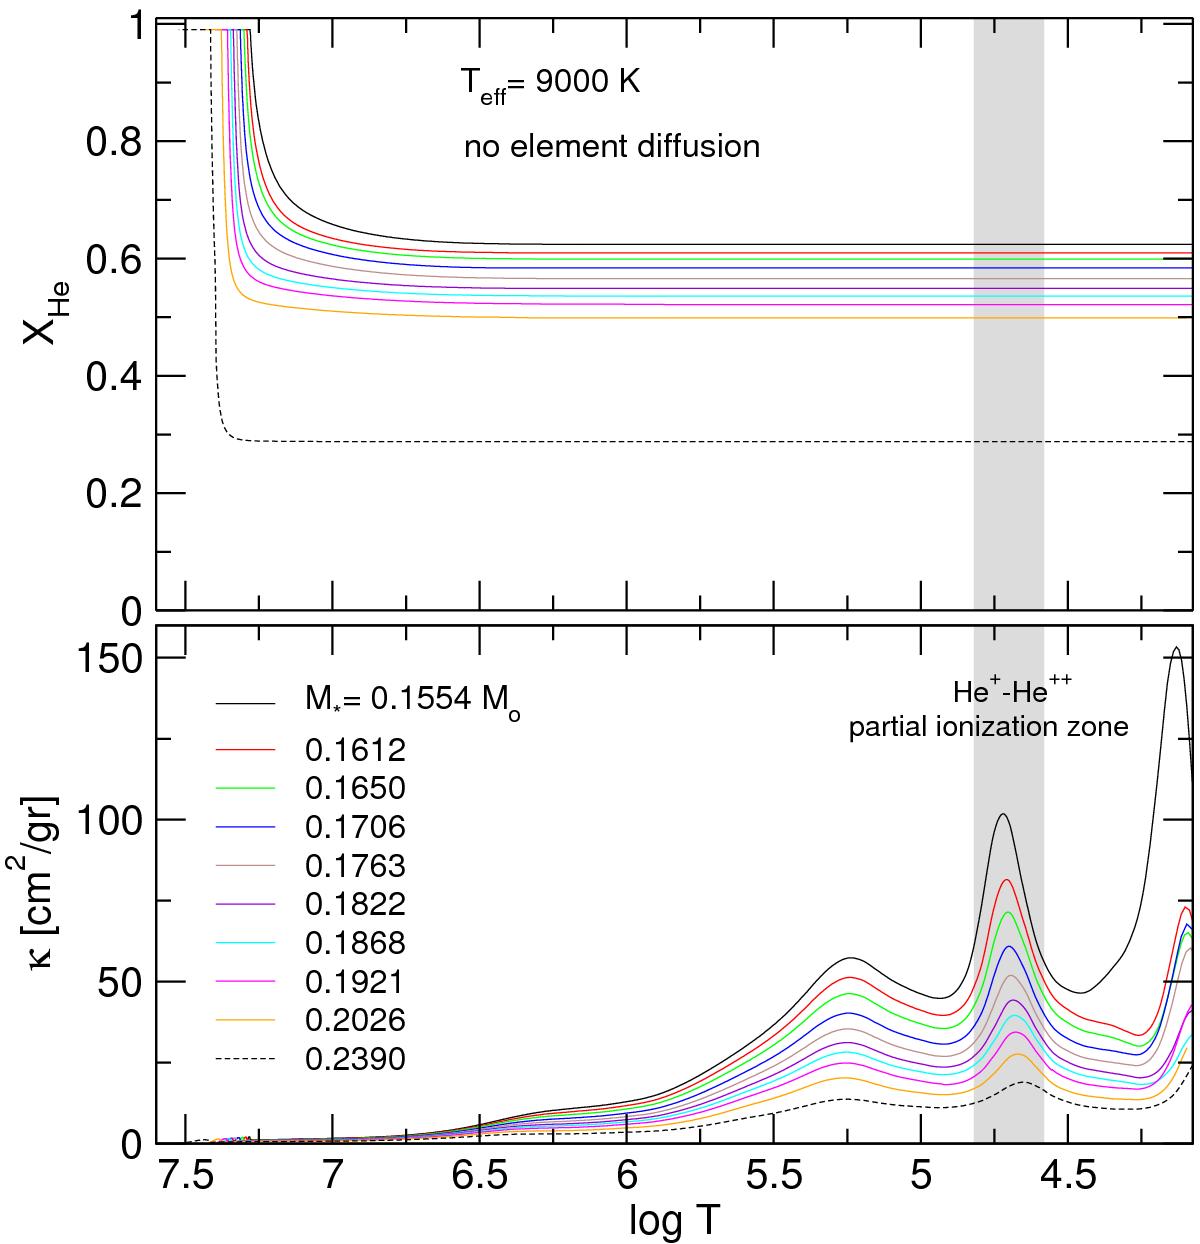
He abundance (upper panel) and the Rosseland opacity (lower panel) in terms of the logarithm of the temperature, corresponding to models at Teff ~ 9000 K and different stellar masses indicated in the plot. The vertical gray strip is the location of the region of mode driving (log T ~ 4.7).
Current usage metrics show cumulative count of Article Views (full-text article views including HTML views, PDF and ePub downloads, according to the available data) and Abstracts Views on Vision4Press platform.
Data correspond to usage on the plateform after 2015. The current usage metrics is available 48-96 hours after online publication and is updated daily on week days.
Initial download of the metrics may take a while.