Fig. 5
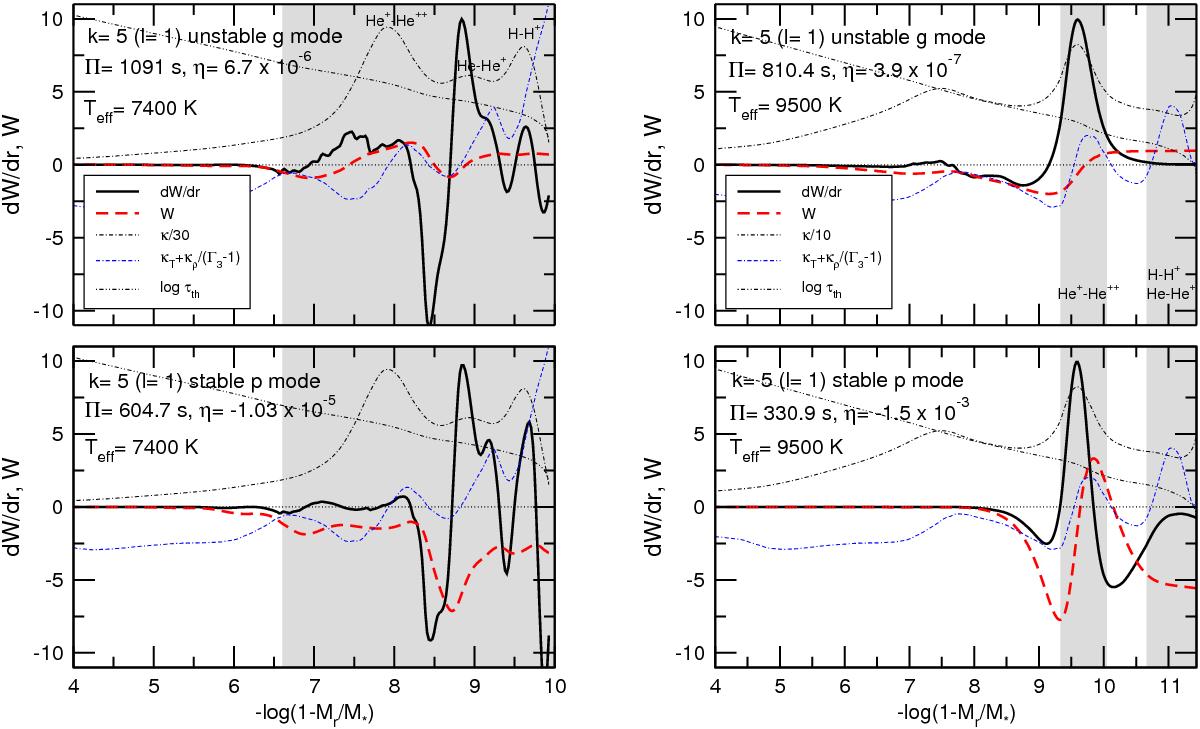
Left panels: the differential work (dW/ dr) and the running work integral (W) for the unstable g mode with k = 5 (upper panel) and the stable p mode with k = 5 (lower panel), along with the Rosseland opacity profile (κ), the opacity derivatives, and the thermal timescale (τth) of our 0.1612 M⊙ pre-WD template model at Teff = 7400 K. The gray areas show the location of the convection zones due to the partial ionization zones. Right panels: same as in the left panels, but for the 0.1612 M⊙ pre-WD template model at Teff = 9500 K.
Current usage metrics show cumulative count of Article Views (full-text article views including HTML views, PDF and ePub downloads, according to the available data) and Abstracts Views on Vision4Press platform.
Data correspond to usage on the plateform after 2015. The current usage metrics is available 48-96 hours after online publication and is updated daily on week days.
Initial download of the metrics may take a while.