Fig. 4
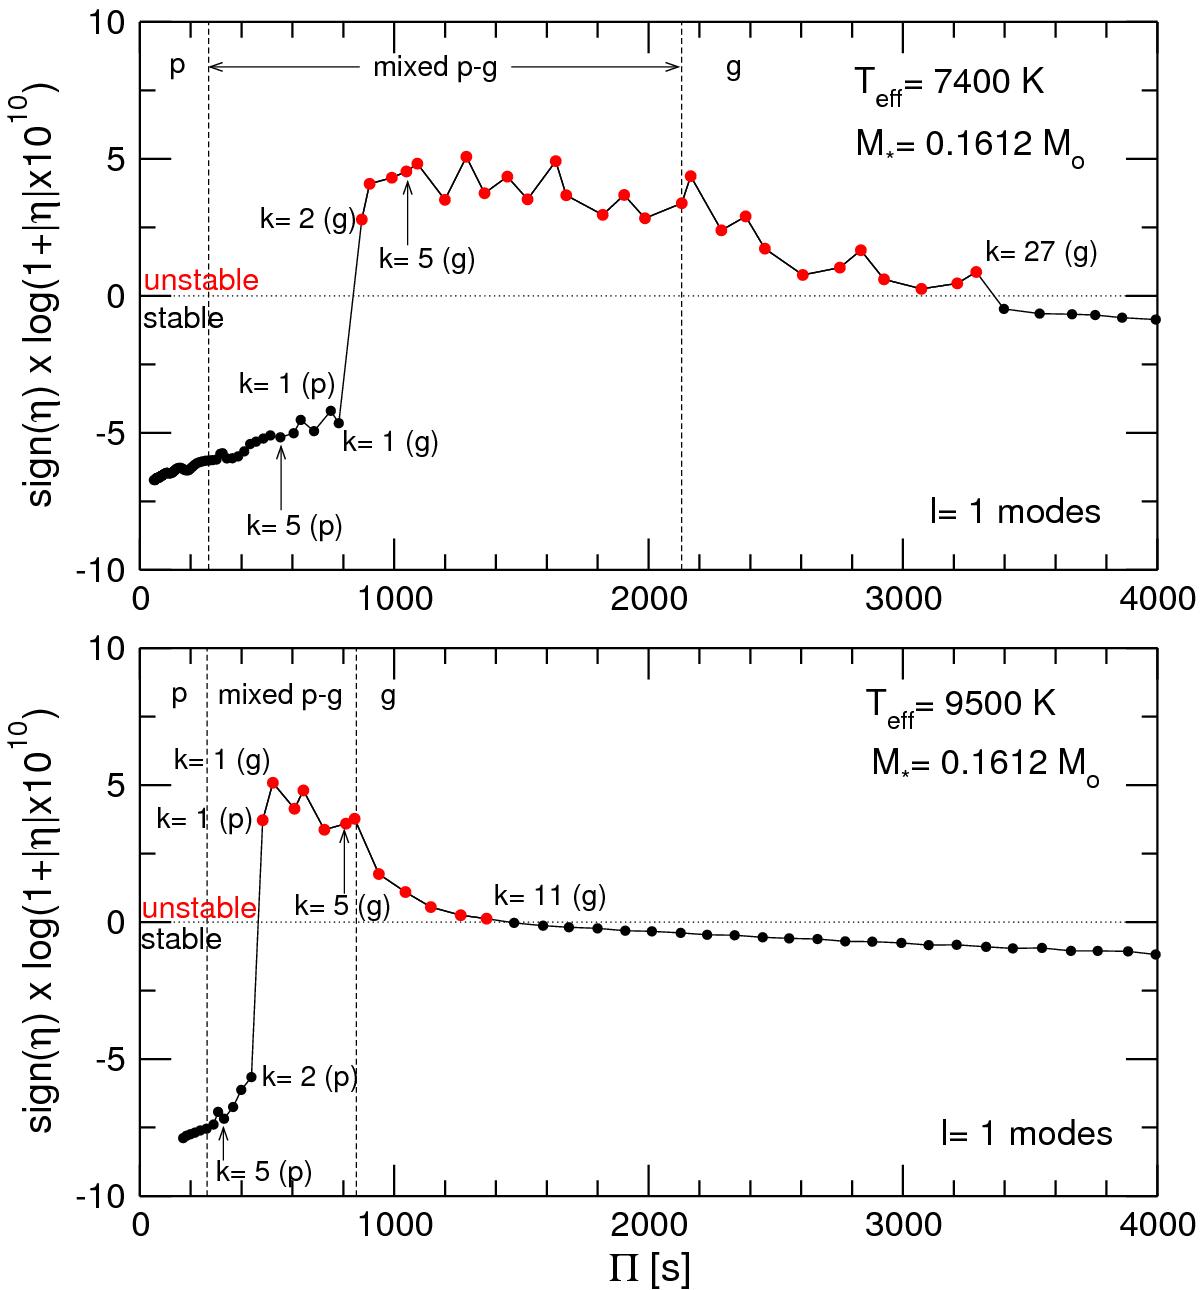
Normalized growth rates η for ℓ = 1p and g modes in terms of the pulsation periods for the 0.1612 M⊙ pre-WD template model at Teff = 7400 K (upper panel) and the 0.1612 M⊙ pre-WD template model at Teff = 9500 K (lower panel). The large numerical range spanned by η is appropriately scaled for a better graphical representation. Some specific modes are labeled. The g and p modes with k = 5 are analyzed in Fig. 5. The vertical dashed lines enclose the period interval of mixed p − g modes. Unstable modes are emphasized with red dots.
Current usage metrics show cumulative count of Article Views (full-text article views including HTML views, PDF and ePub downloads, according to the available data) and Abstracts Views on Vision4Press platform.
Data correspond to usage on the plateform after 2015. The current usage metrics is available 48-96 hours after online publication and is updated daily on week days.
Initial download of the metrics may take a while.