Fig. 15
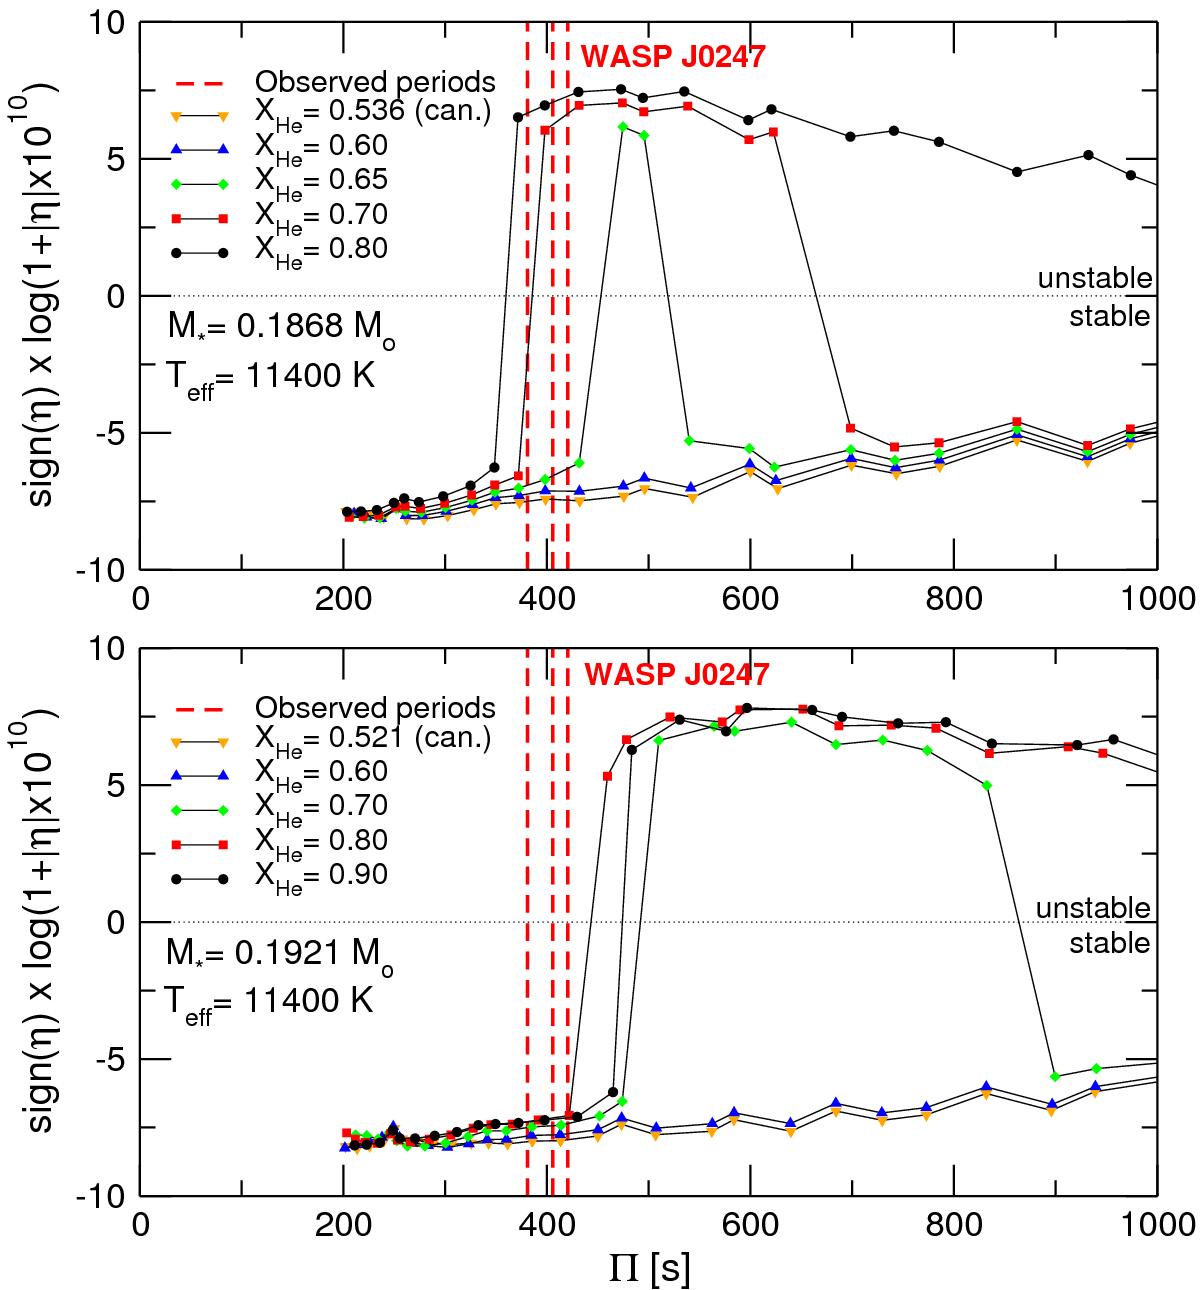
Normalized growth rates η for ℓ = 1 modes in terms of the pulsation periods for 0.1868 M⊙ pre-WD models at Teff ~ 11 400 K (upper panel) and for 0.1921 M⊙ pre-WD models at the same Teff (lower panel). Different symbols connected with thin lines are associated with models with different He abundance in the driving region, including that with canonical He abundance and those models (artificially modified) with increasing XHe values in that region (see text). The large numerical range spanned by η is appropriately scaled for a better graphical representation. The vertical dashed lines correspond to the periods at ~381 s, ~406 s, and ~421 s observed in WASP J0247−25B.
Current usage metrics show cumulative count of Article Views (full-text article views including HTML views, PDF and ePub downloads, according to the available data) and Abstracts Views on Vision4Press platform.
Data correspond to usage on the plateform after 2015. The current usage metrics is available 48-96 hours after online publication and is updated daily on week days.
Initial download of the metrics may take a while.