Fig. 12
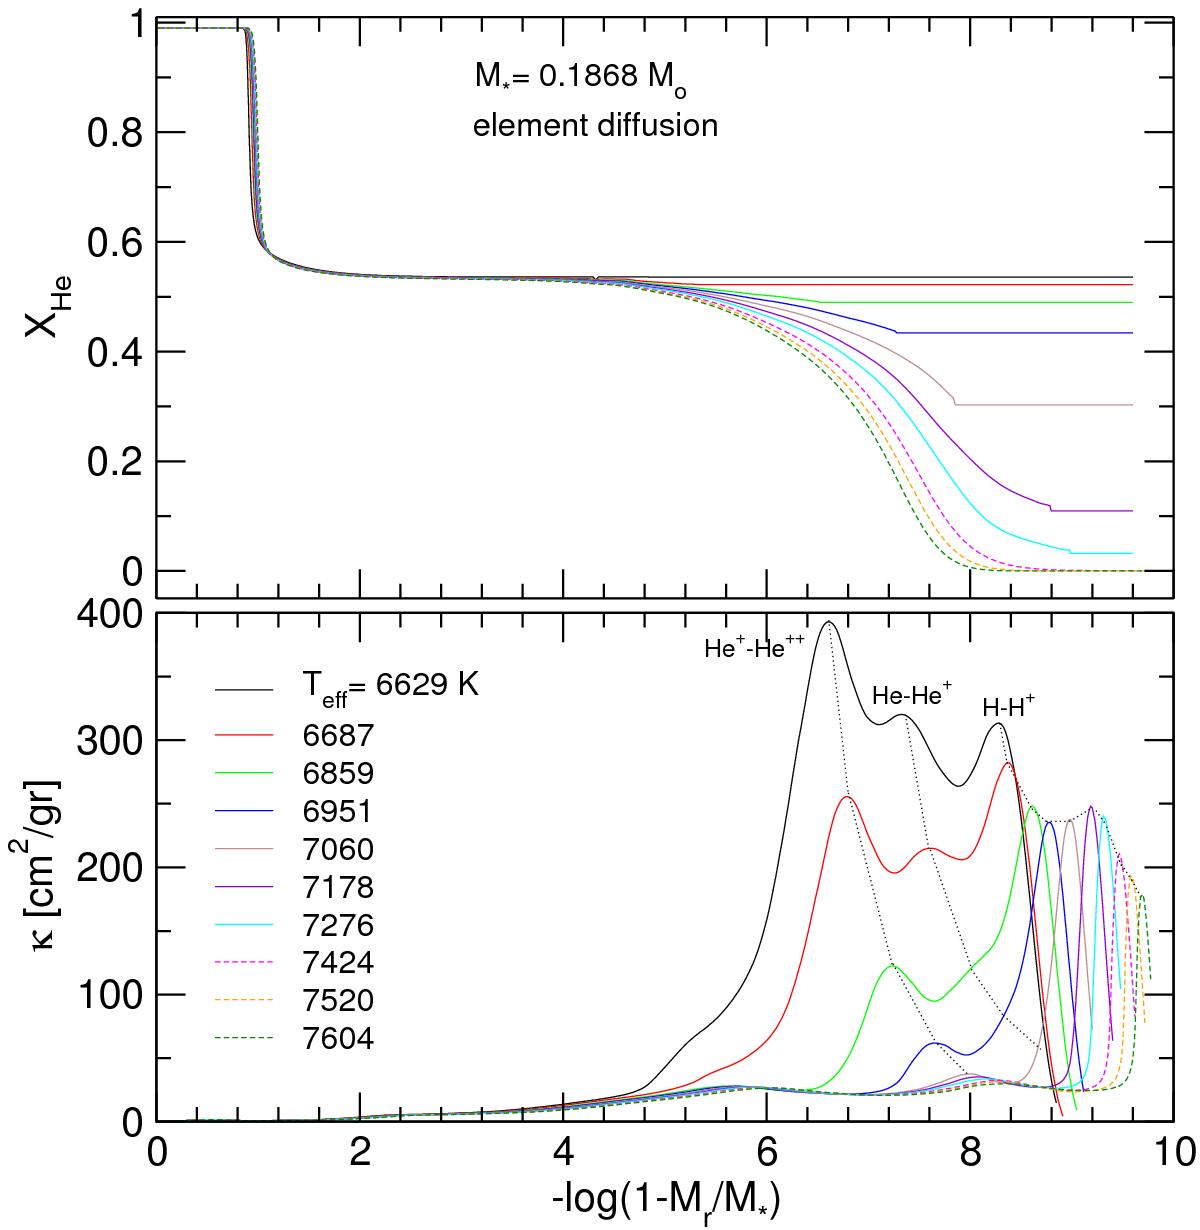
He abundance (upper panel) and the Rosseland opacity (lower panel) in terms of the outer mass fraction coordinate, corresponding to models with M⋆ = 0.1868 M⊙ with element diffusion and different (increasing) values of Teff, which are marked in Fig. 13. Solid curves correspond to models in which there is pulsation instability, while dashed curves are associated with models in which instability has ceased. The tops of the bumps in the opacity due to the He+ −He++, He−He+, and H−H+ partial ionization regions are connected with thin dotted lines, to show their evolution.
Current usage metrics show cumulative count of Article Views (full-text article views including HTML views, PDF and ePub downloads, according to the available data) and Abstracts Views on Vision4Press platform.
Data correspond to usage on the plateform after 2015. The current usage metrics is available 48-96 hours after online publication and is updated daily on week days.
Initial download of the metrics may take a while.