Fig. 1
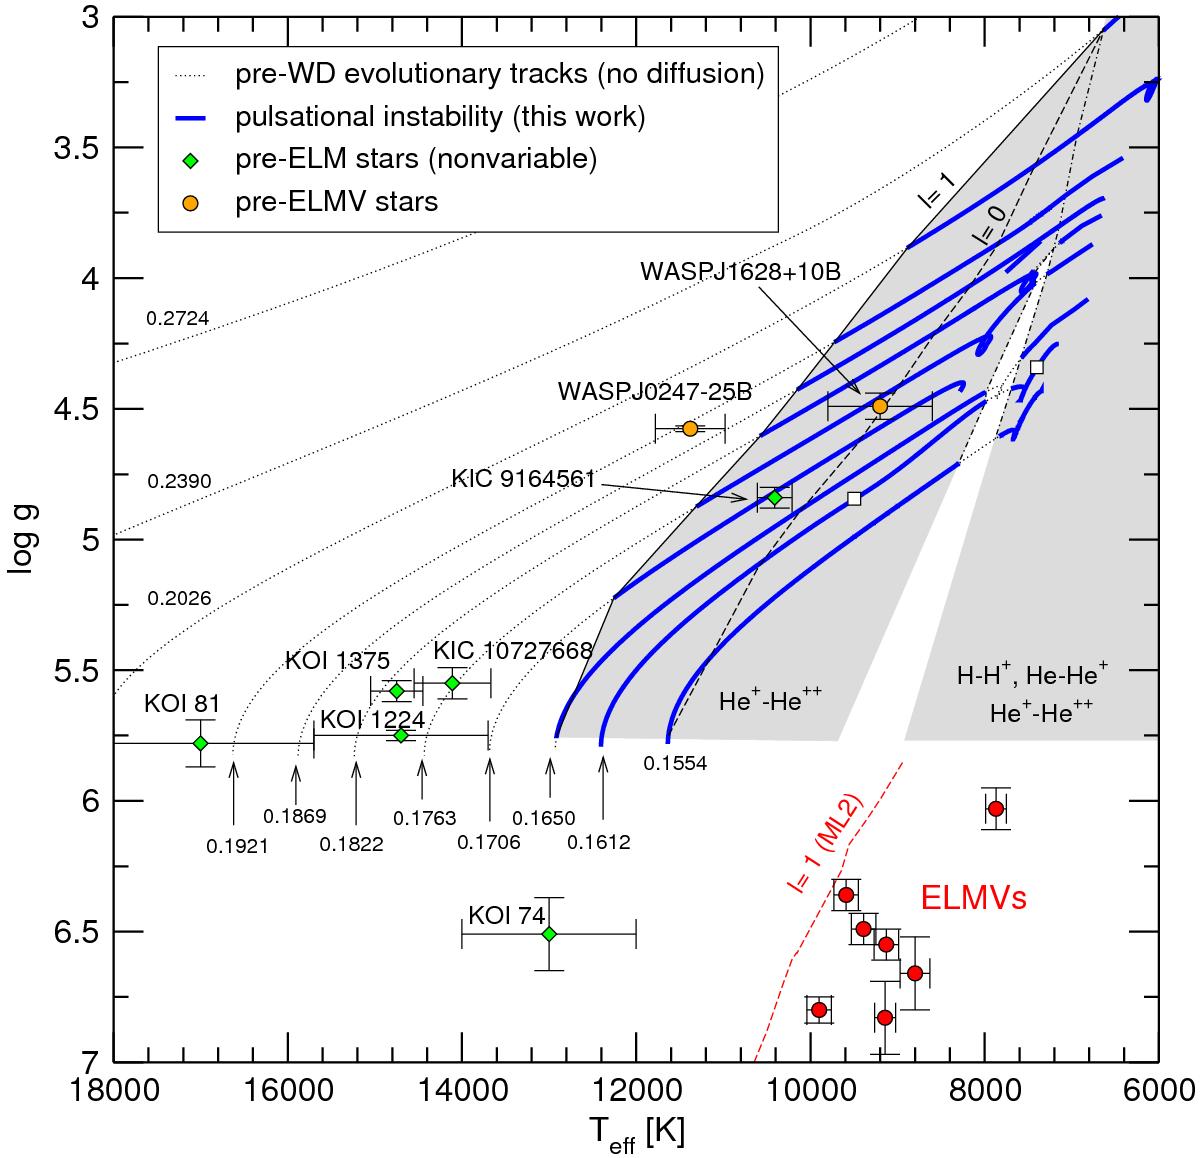
Teff − log g diagram showing our low-mass He-core pre-WD evolutionary tracks (dotted curves) computed neglecting element diffusion. Numbers correspond to the stellar mass of each sequence. The locations (with their uncertainties) of the known ELMVs are marked with red dots, along with the theoretical ℓ = 1g-mode blue edge (red dashed curve) computed by Córsico & Althaus (2016). Orange dots with error bars correspond to the pre-ELMV stars discovered by Maxted et al. (2013, 2014), and light green diamonds depict the location of pre-ELM (nonvariable) WDs observed in the Kepler mission field. The solid black line indicates the nonradial dipole (ℓ = 1) blue edge of the pre-ELMV instability domain (emphasized as a gray area, which is an extrapolation) due to the κ − γ mechanism acting at the He+ −He++ partial ionization region, as obtained in this work. The ℓ = 2 blue edge (not plotted) is nearly coincident with the ℓ = 1 blue edge (see Sect. 3.1). Similarly, the dashed black line indicates the blue edge of the instability strip for radial (ℓ = 0) modes. Stellar models having unstable nonradial modes are emphasized on the evolutionary tracks with thick blue lines. The dot-dashed black lines mark the limits between the instability zones in which the partial ionization of H−H+ and He−He+ does contribute to the driving of modes (right zone) and does not (left zone). The two hollow squares on the evolutionary track of M⋆ = 0.1612 M⊙ indicate the location of the template models analyzed in Sect. 3.
Current usage metrics show cumulative count of Article Views (full-text article views including HTML views, PDF and ePub downloads, according to the available data) and Abstracts Views on Vision4Press platform.
Data correspond to usage on the plateform after 2015. The current usage metrics is available 48-96 hours after online publication and is updated daily on week days.
Initial download of the metrics may take a while.