Fig. 6
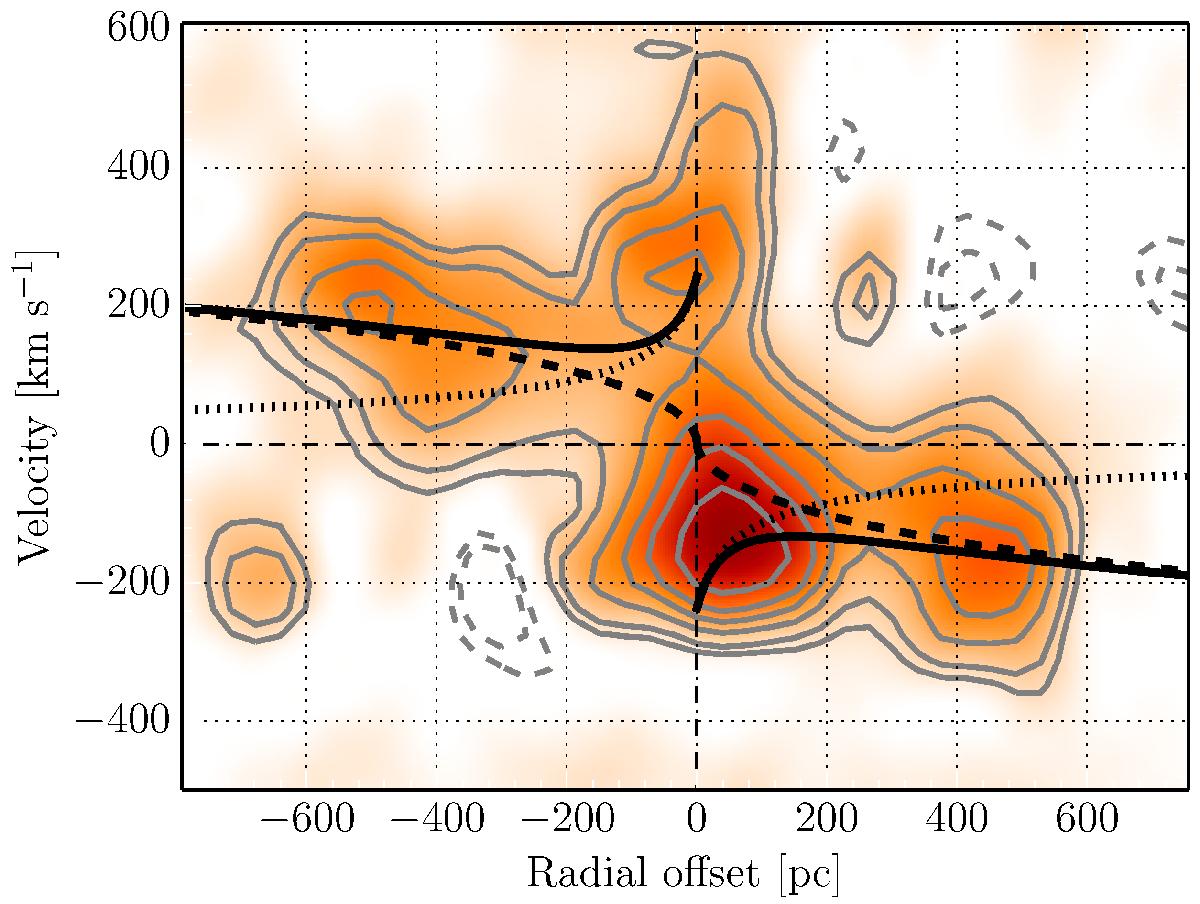
Position velocity plot of the H 2 1–0 S(1) line extracted along the major axis of the inner disk. Contour levels are –3, –2, 2, 3, 5, 7,9, and 12σ. The black dashed line shows the rotation curve predicted from the stellar photometry, while the fine dashed line shows the contribution of the SMBH to the rotation. The solid line is the total rotation curve derived from the two. In the centre at velocities ≳+220 km s-1, we identify a component of H 2 deviating from the predicted rotation curve (see Sect. 3.2 for further details).
Current usage metrics show cumulative count of Article Views (full-text article views including HTML views, PDF and ePub downloads, according to the available data) and Abstracts Views on Vision4Press platform.
Data correspond to usage on the plateform after 2015. The current usage metrics is available 48-96 hours after online publication and is updated daily on week days.
Initial download of the metrics may take a while.