Free Access
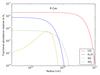
Fig. 8
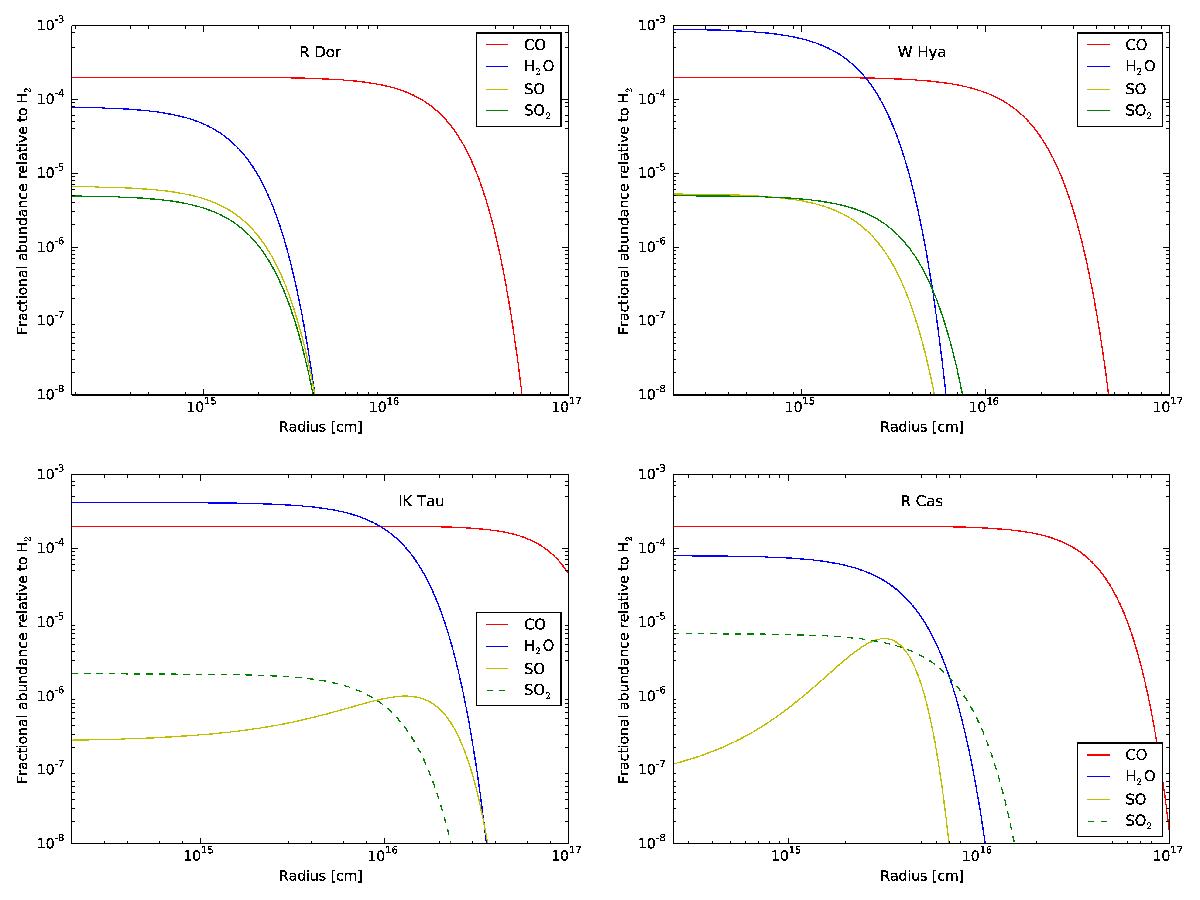
Abundance profiles for R Dor, W Hya, IK Tau and R Cas. The abundances for CO and H2O are taken from Maercker et al. (in prep.), except for W Hya, for which they are taken from Khouri et al. (2014a,b). The dashed line for the SO2 results for IK Tau and R Cas indicates that they are tentative.
This figure is made of several images, please see below:
Current usage metrics show cumulative count of Article Views (full-text article views including HTML views, PDF and ePub downloads, according to the available data) and Abstracts Views on Vision4Press platform.
Data correspond to usage on the plateform after 2015. The current usage metrics is available 48-96 hours after online publication and is updated daily on week days.
Initial download of the metrics may take a while.