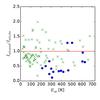
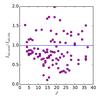
Fig. 7
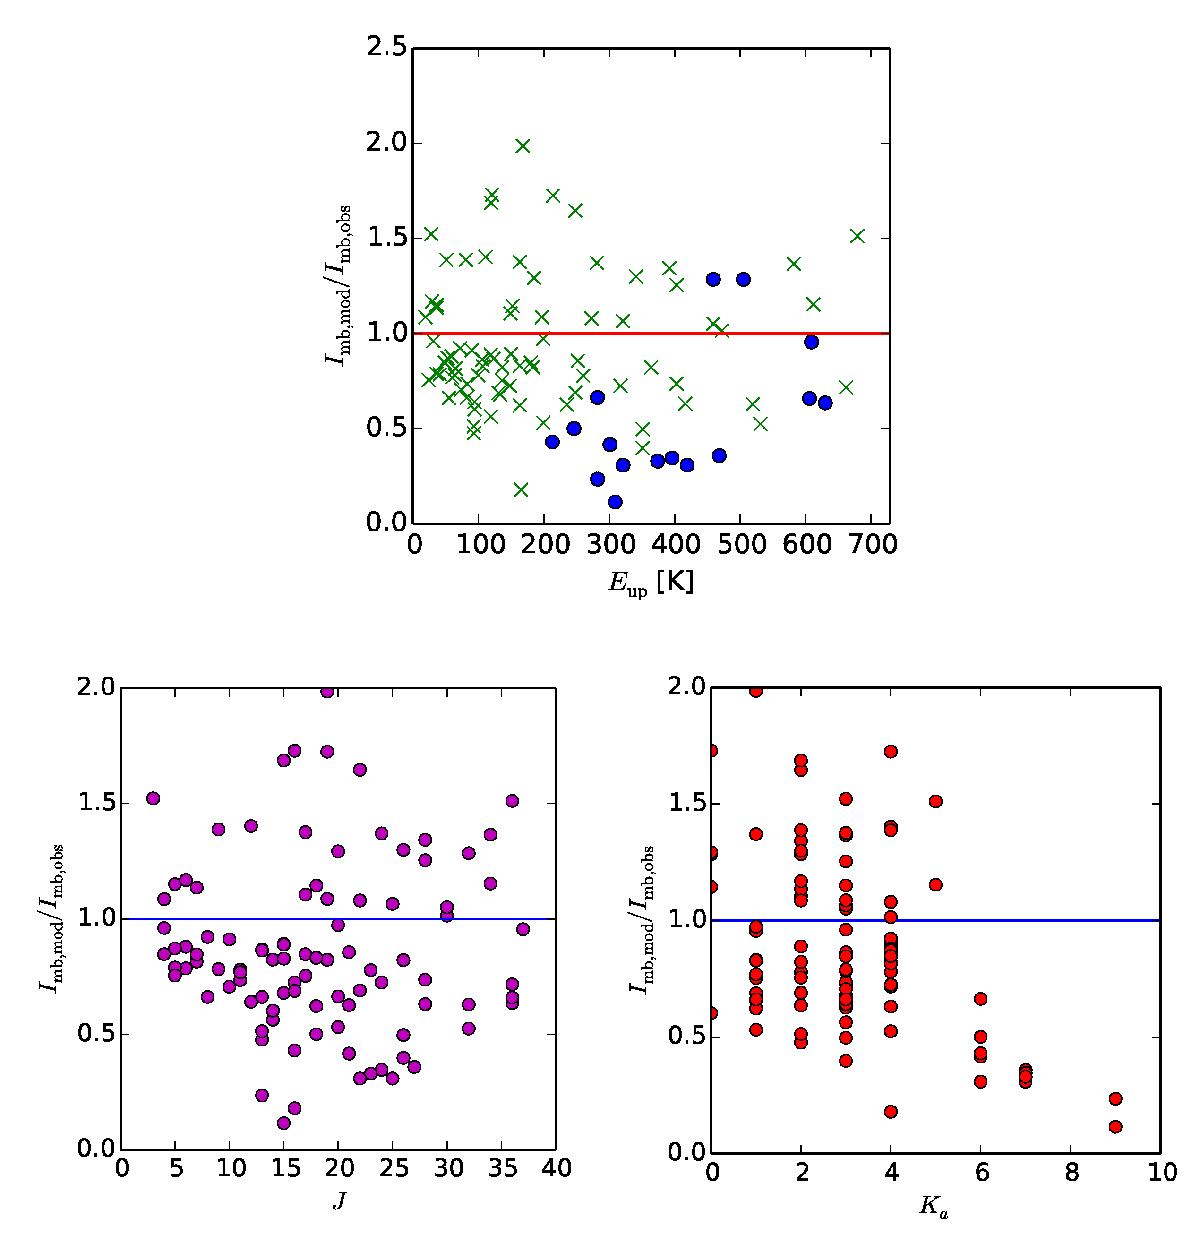
SO2 goodness of fit plots for R Dor. Top: goodness of fit with upper energy level of the transition. HIFI lines are shown as blue points and APEX lines are shown as green crosses. Error bars are excluded to make the plot clearer to read. Lower left: goodness of fit with J. Lower right: goodness of fit with Ka, a clear downwards trend for Ka ≥ 6.
Current usage metrics show cumulative count of Article Views (full-text article views including HTML views, PDF and ePub downloads, according to the available data) and Abstracts Views on Vision4Press platform.
Data correspond to usage on the plateform after 2015. The current usage metrics is available 48-96 hours after online publication and is updated daily on week days.
Initial download of the metrics may take a while.