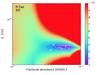
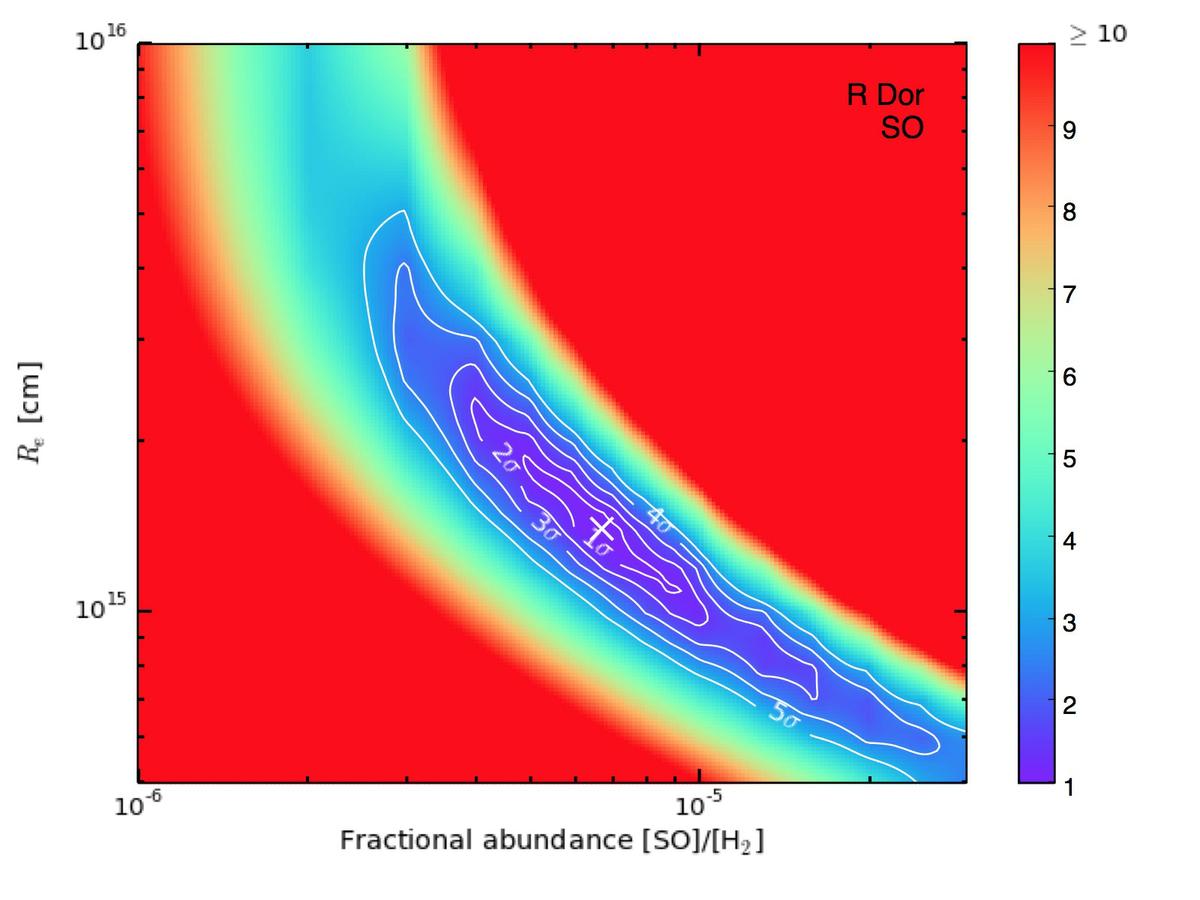
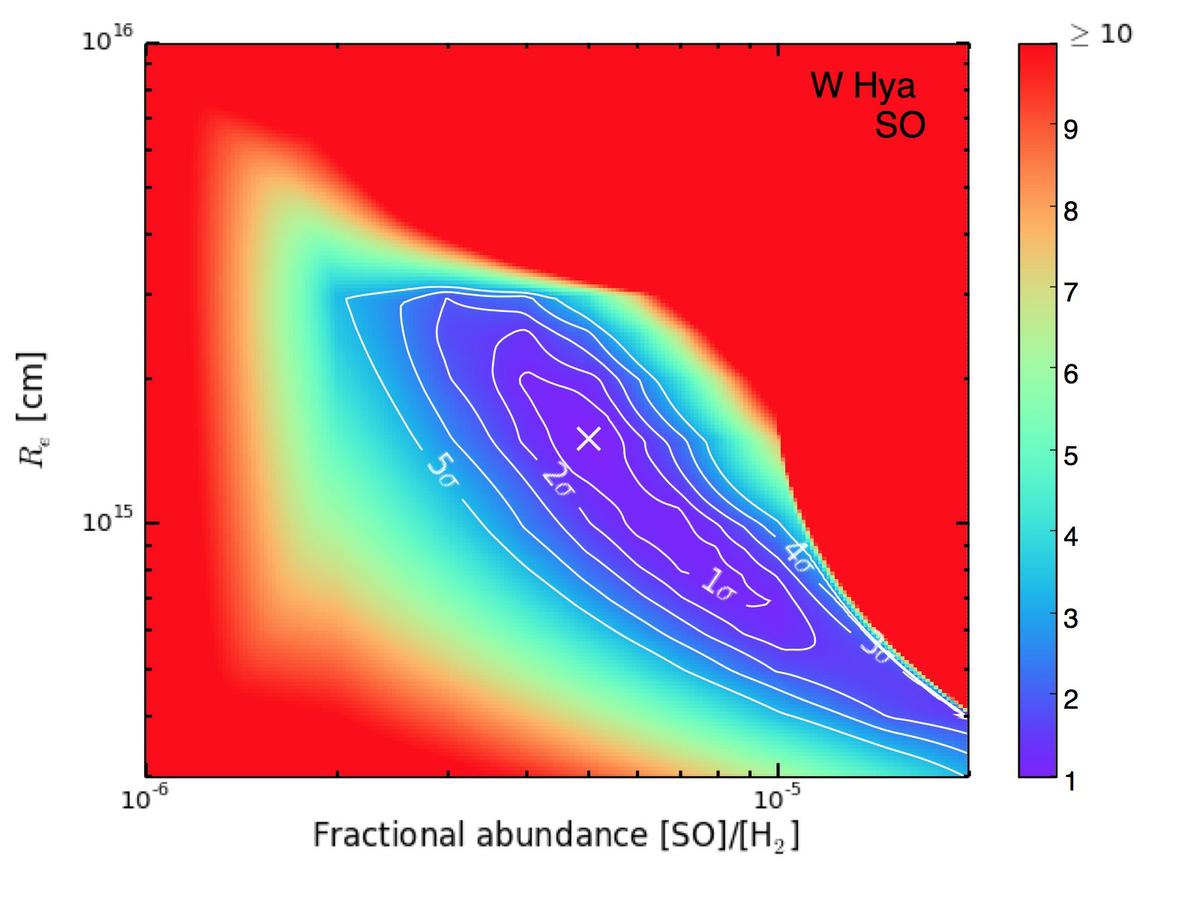
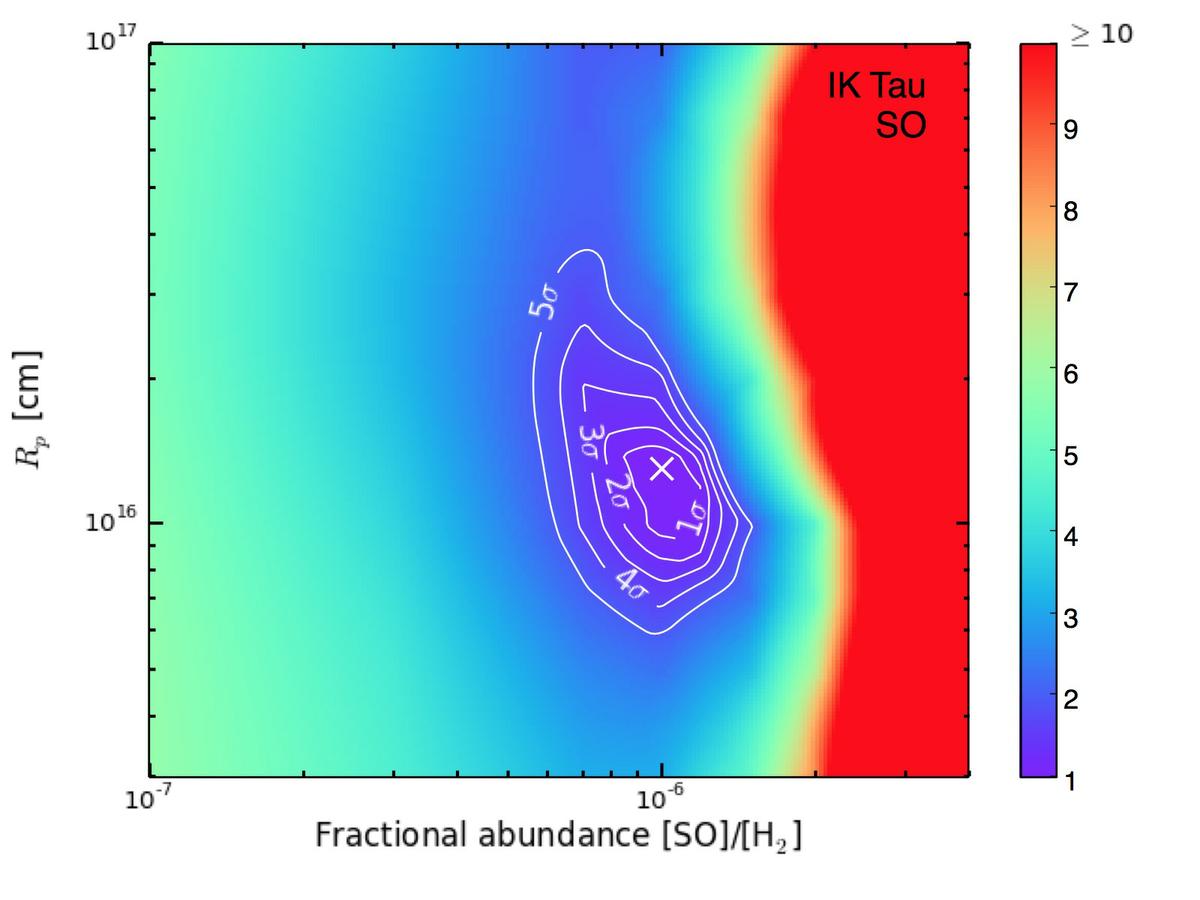
Fig. 3
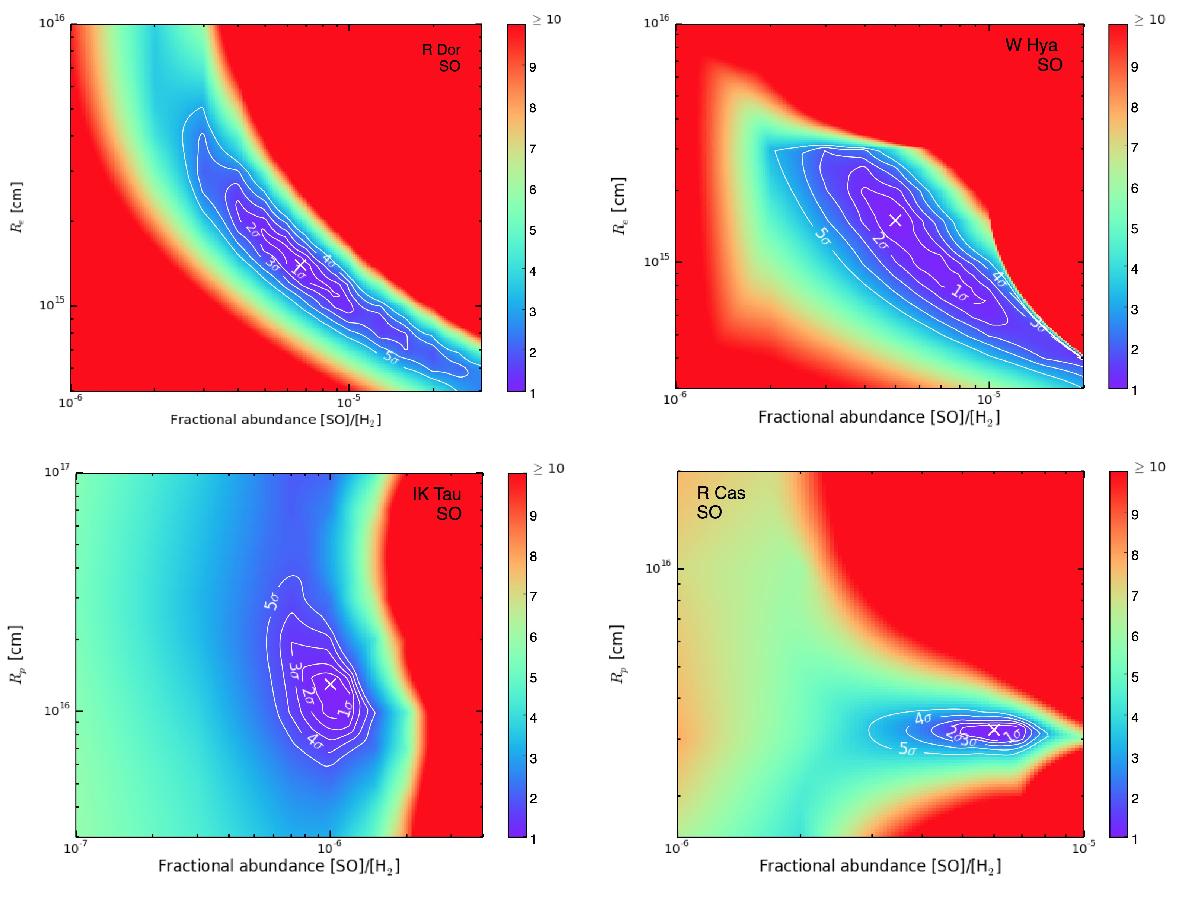
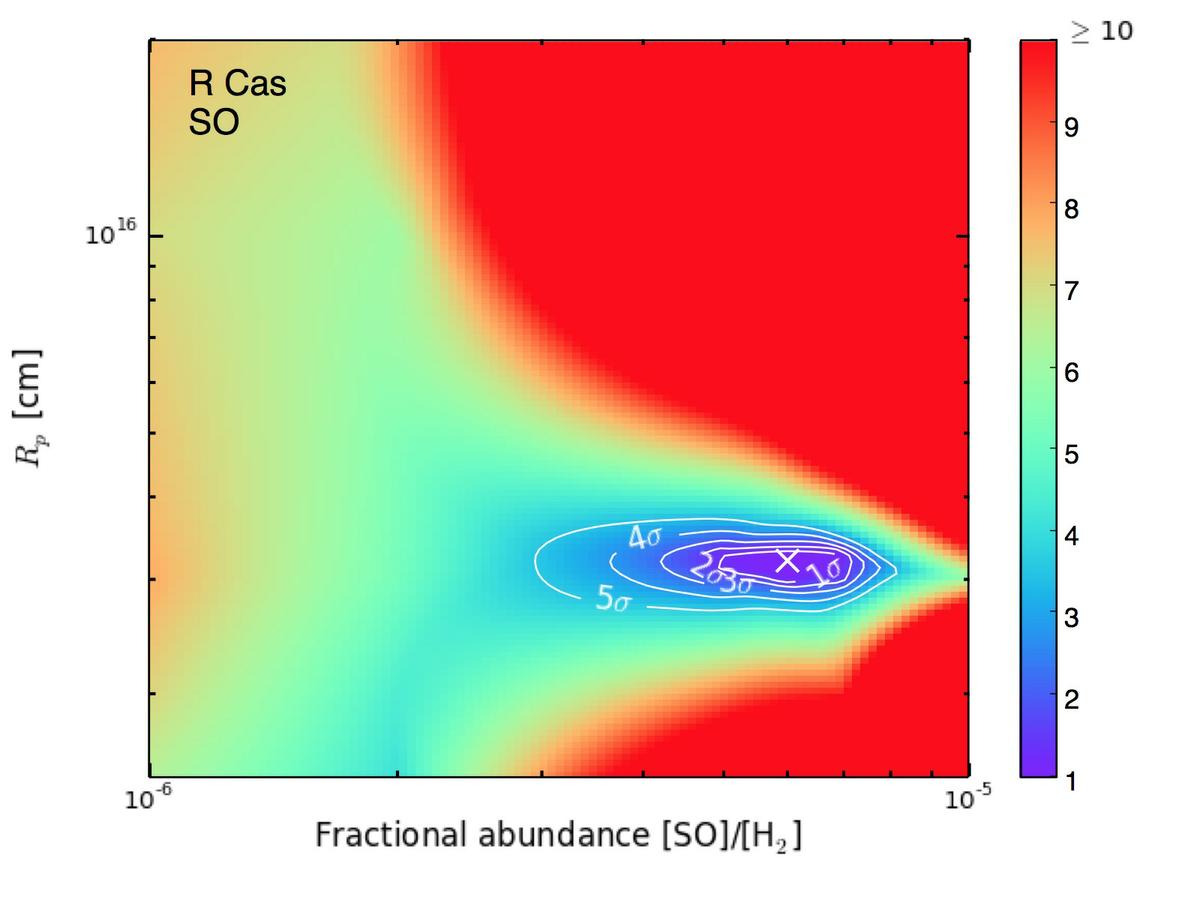
SO χ2 plots for R Dor, W Hya, IK Tau and R Cas. The contours show the confidence intervals and the shading represents the ![]() value for the corresponding model, with the colour-bar indicating multiples of the minimum
value for the corresponding model, with the colour-bar indicating multiples of the minimum ![]() value. The white cross indicates our best-fit model (see Table 6). For IK Tau, the slice for which Rw = 1.8Rp is shown. For R Cas, the slice for which Rw = 1.0Rp is shown.
value. The white cross indicates our best-fit model (see Table 6). For IK Tau, the slice for which Rw = 1.8Rp is shown. For R Cas, the slice for which Rw = 1.0Rp is shown.
Current usage metrics show cumulative count of Article Views (full-text article views including HTML views, PDF and ePub downloads, according to the available data) and Abstracts Views on Vision4Press platform.
Data correspond to usage on the plateform after 2015. The current usage metrics is available 48-96 hours after online publication and is updated daily on week days.
Initial download of the metrics may take a while.