Free Access
Fig. 19
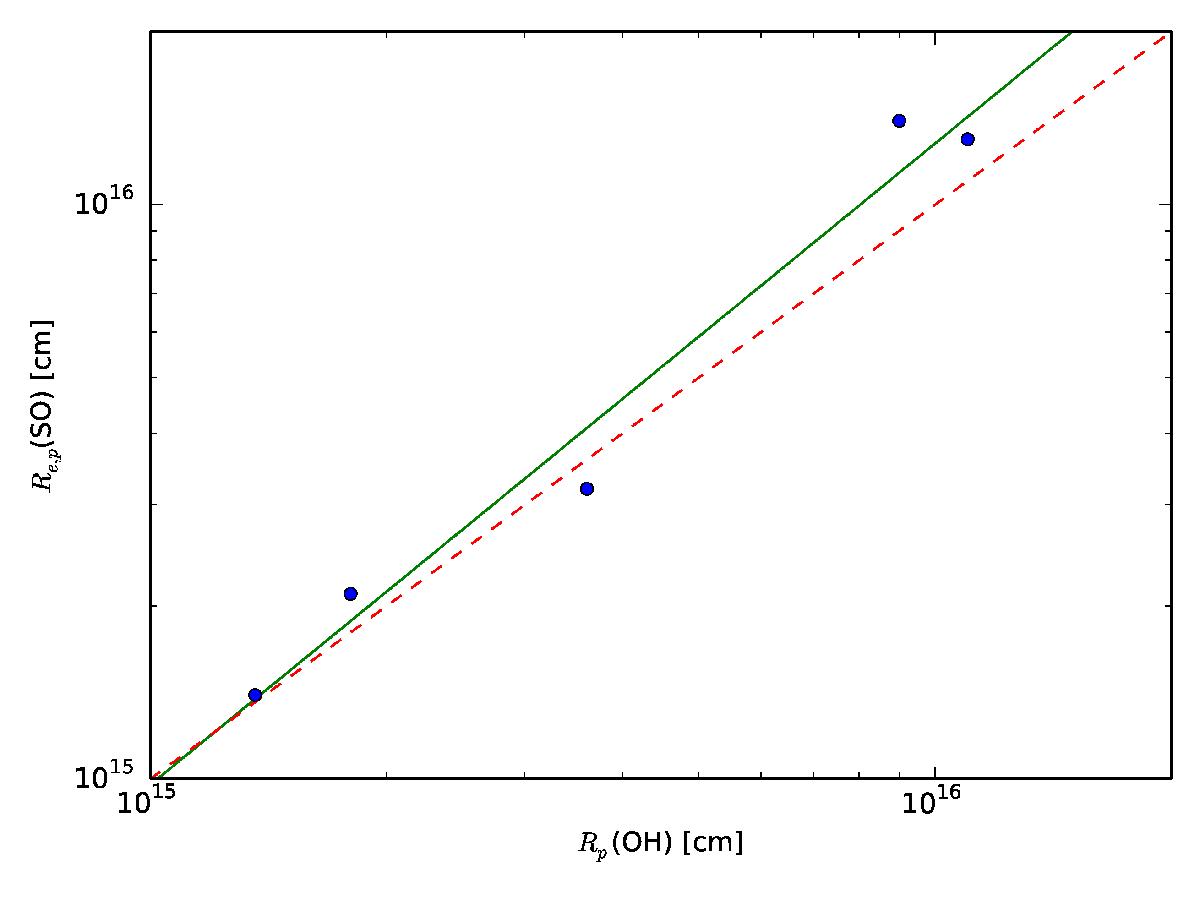
Peak abundance radii of SO (for R Cas, TX Cam, and IK Tau) and e-folding radii of SO (for R Dor and W Hya), plotted against the e-folding radii of H2O found by Maercker et al. (in prep.) and Khouri et al. (2014b, for W Hya). The solid green line is the best fit to the data and the dashed red line traces a 1:1 relationship.
Current usage metrics show cumulative count of Article Views (full-text article views including HTML views, PDF and ePub downloads, according to the available data) and Abstracts Views on Vision4Press platform.
Data correspond to usage on the plateform after 2015. The current usage metrics is available 48-96 hours after online publication and is updated daily on week days.
Initial download of the metrics may take a while.