Fig. 18
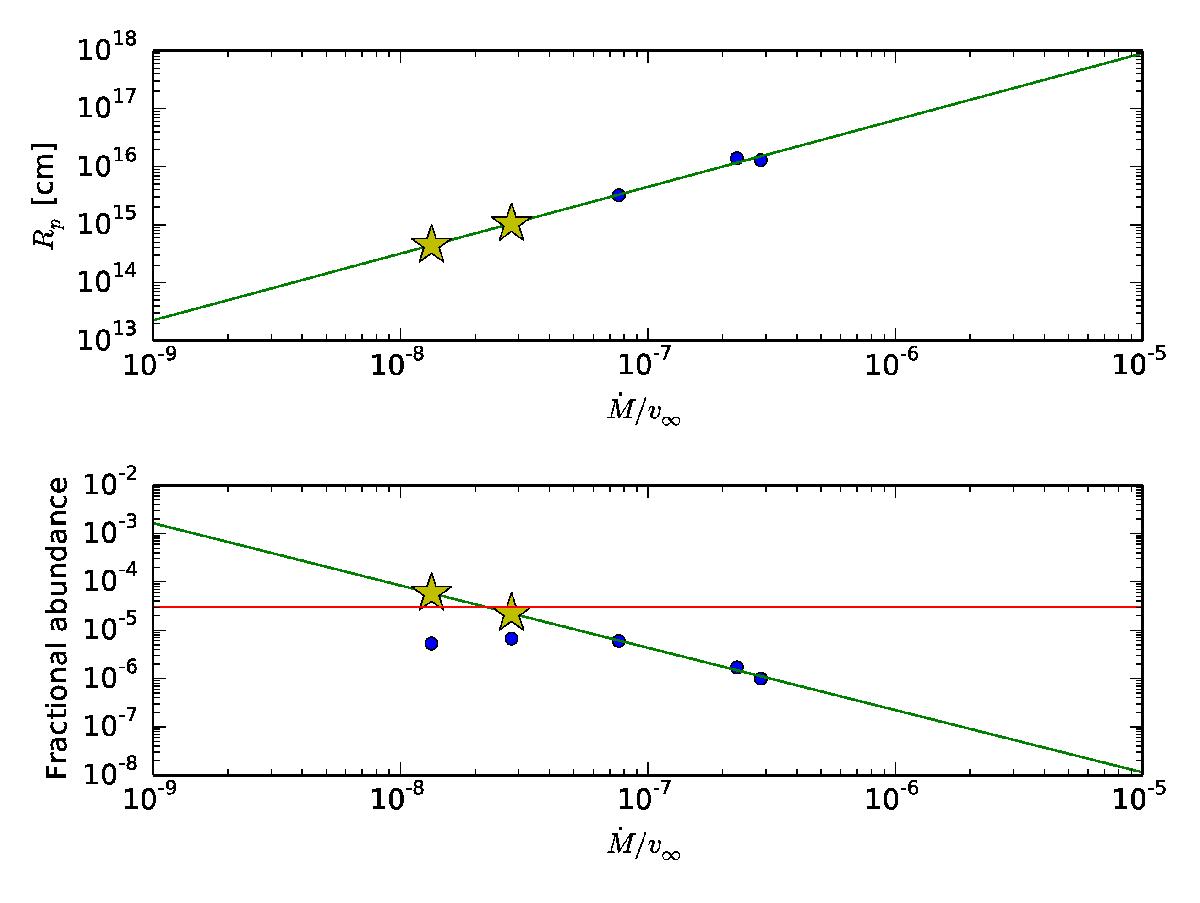
Trends in SO peak radius (top) and fractional abundance (bottom) against the circumstellar density measure, Ṁ/υ∞. The green lines are the trends fitted to the three higher mass-loss rate stars (R Cas, TX Cam and IK Tau), while the yellow stars are the predicted locations of the lower mass-loss rate stars (R Dor and W Hya) based on the trend. In the fractional abundance plot, the red line shows the hard limit for SO abundance based on solar S abundance and the blue points in line with the yellow stars represent the real abundance values for R Dor and W Hya.
Current usage metrics show cumulative count of Article Views (full-text article views including HTML views, PDF and ePub downloads, according to the available data) and Abstracts Views on Vision4Press platform.
Data correspond to usage on the plateform after 2015. The current usage metrics is available 48-96 hours after online publication and is updated daily on week days.
Initial download of the metrics may take a while.