Free Access
Fig. 17
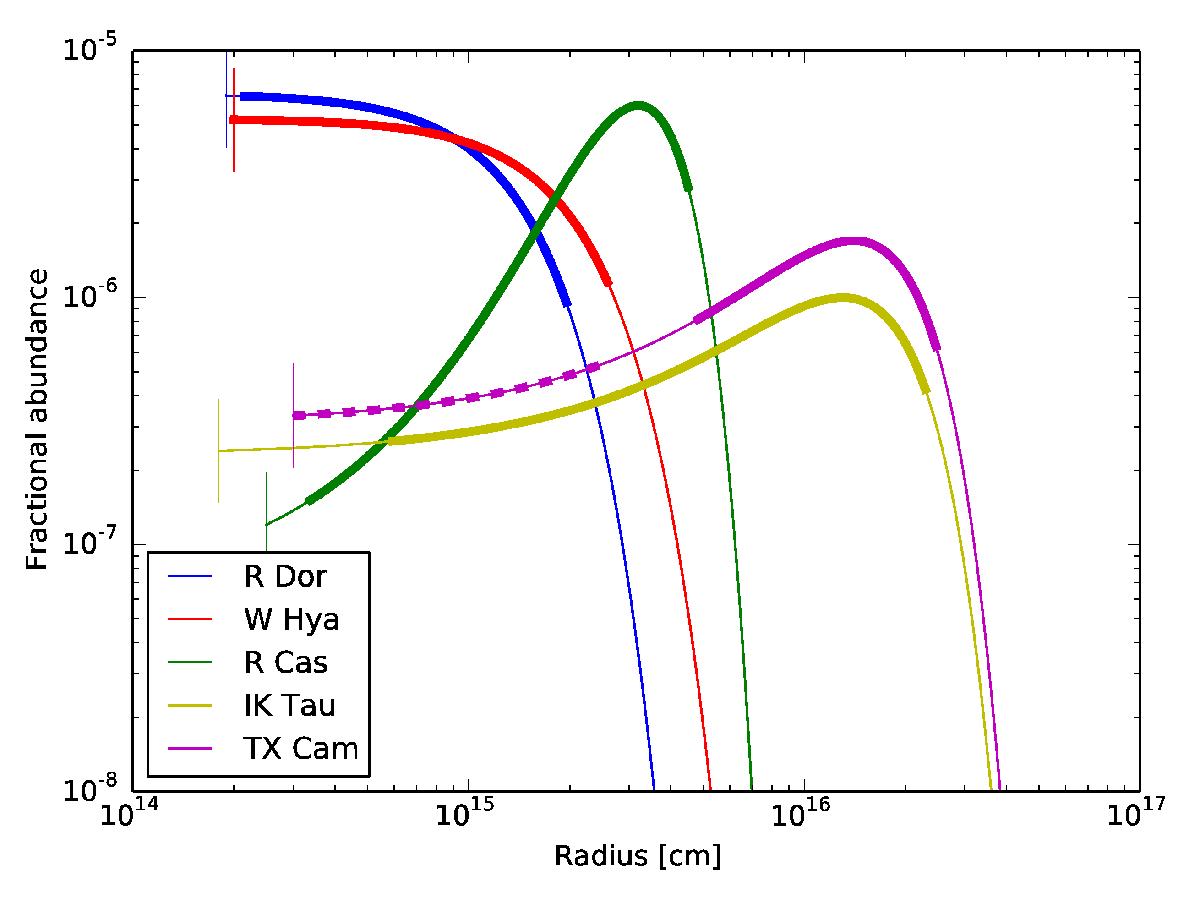
SO abundance distributions for all stars modelled. The vertical lines represent the dust condensation radii, where our models stop. The thicker sections of the curves represent the area probed by our observations and for TX Cam the thick dashed line is the area probed by the upper limits imposed by the HIFI non-detections.
Current usage metrics show cumulative count of Article Views (full-text article views including HTML views, PDF and ePub downloads, according to the available data) and Abstracts Views on Vision4Press platform.
Data correspond to usage on the plateform after 2015. The current usage metrics is available 48-96 hours after online publication and is updated daily on week days.
Initial download of the metrics may take a while.