Fig. A.2
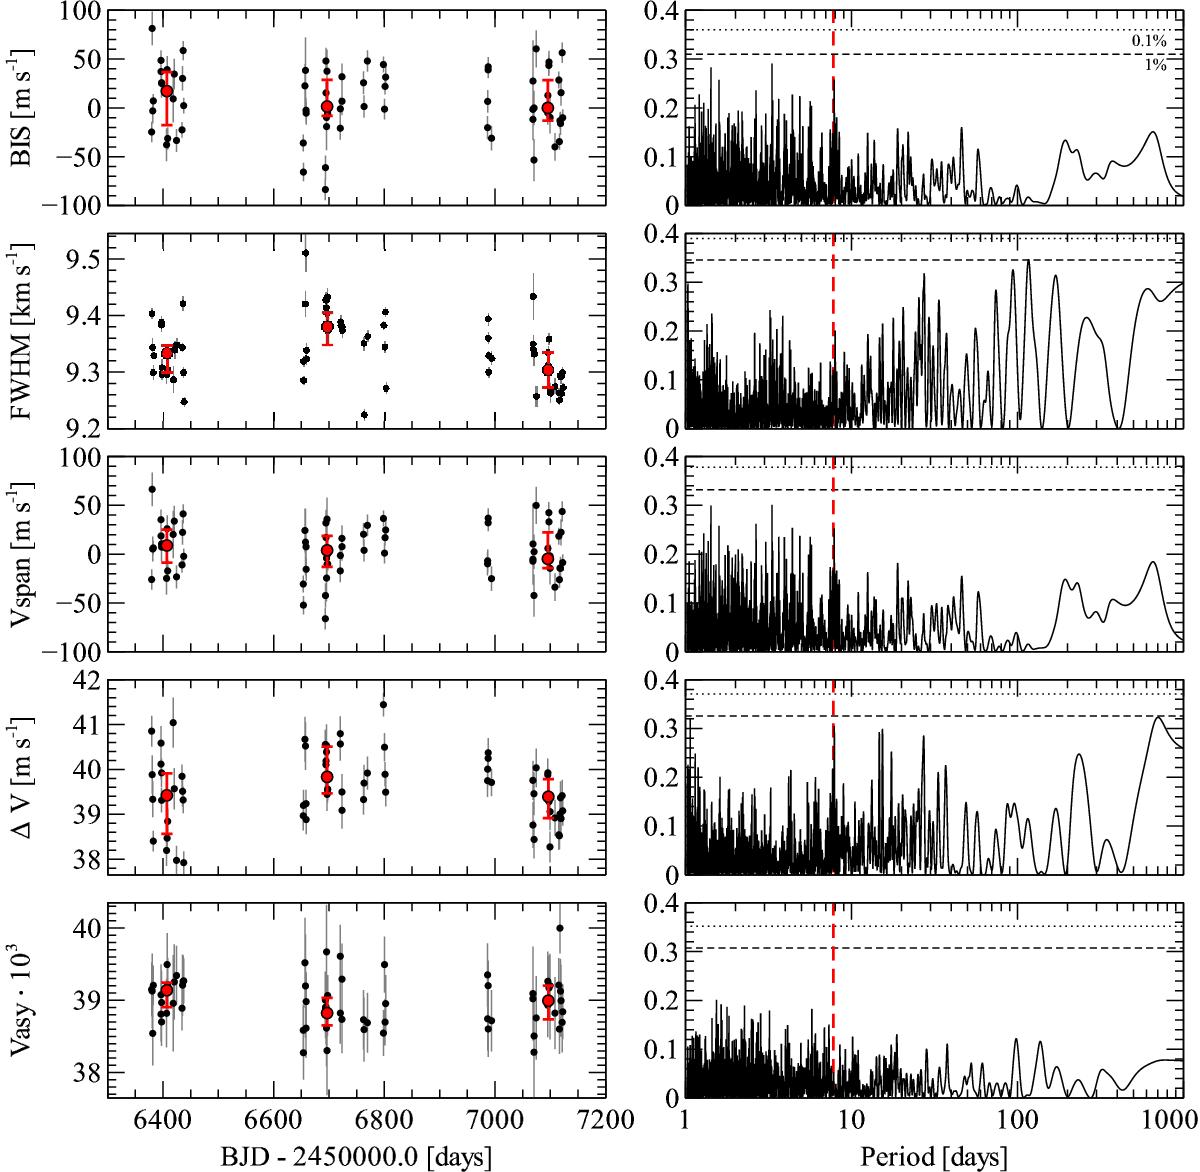
Asymmetry indicators as a function of time (panels on the left) and their corresponding GLS periodogram (panels on the right). From top to bottom: the bisector inverse span BIS, the FWHM of the CCF, the RV span, the ΔV and Vasy. Seasonal medians with the first and third quartiles are indicated in red. The rotational period of the star is indicated with a red vertical line. The 1% and 0.1% FAP levels are displayed as dashed and dotted horizontal lines, respectively. The extra power in the FWHM periodogram is due to a drift in the instrumental resolution, corrected in March 2014 (JD ≃ 2 456 370).
Current usage metrics show cumulative count of Article Views (full-text article views including HTML views, PDF and ePub downloads, according to the available data) and Abstracts Views on Vision4Press platform.
Data correspond to usage on the plateform after 2015. The current usage metrics is available 48-96 hours after online publication and is updated daily on week days.
Initial download of the metrics may take a while.