Free Access
Fig. 5
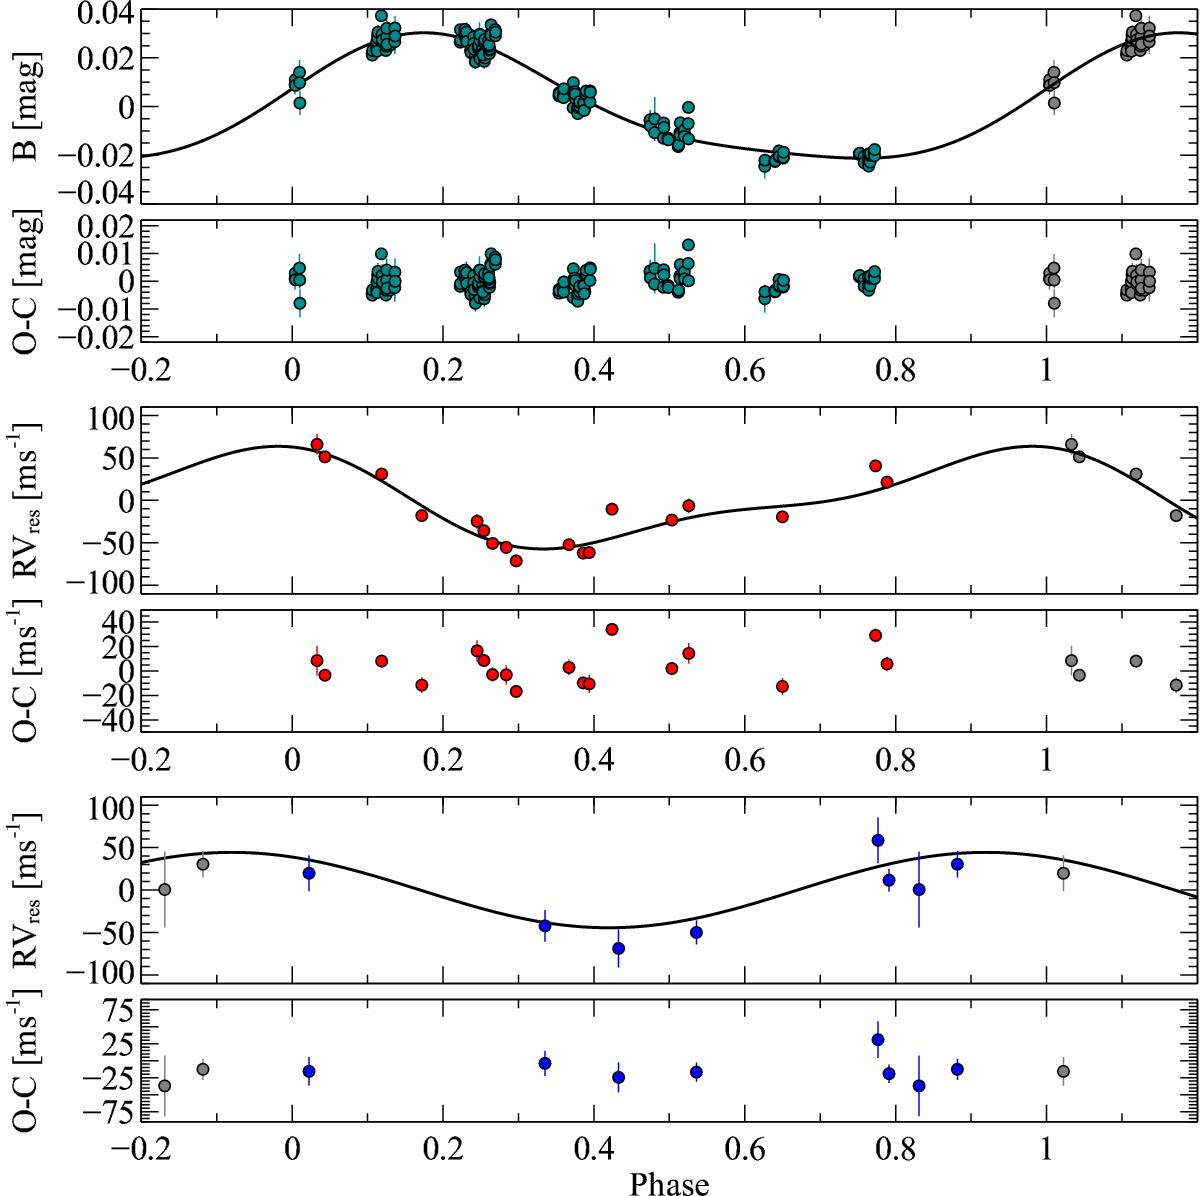
Activity model for the data gathered in 2013. Upper panel: photometric light curve with residuals. Middle and lower panels: RV data from HARPS-N and TRES, respectively (color coded as in Fig. 1), after removing the two-planet solution. Data have been phased on the rotational period obtained from the global fit.
Current usage metrics show cumulative count of Article Views (full-text article views including HTML views, PDF and ePub downloads, according to the available data) and Abstracts Views on Vision4Press platform.
Data correspond to usage on the plateform after 2015. The current usage metrics is available 48-96 hours after online publication and is updated daily on week days.
Initial download of the metrics may take a while.