Fig. 4
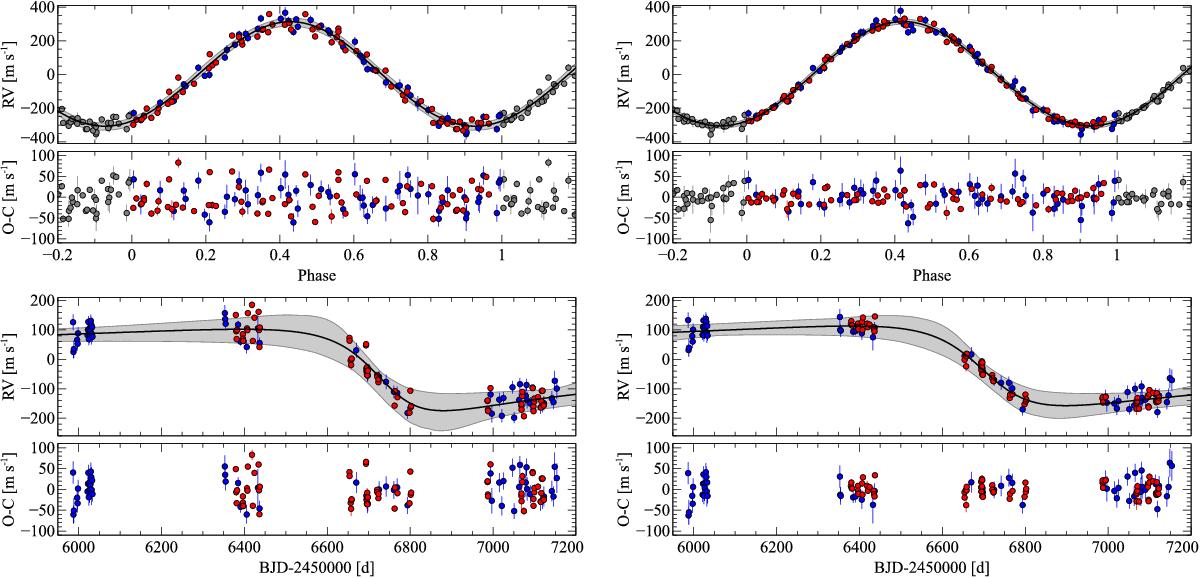
Orbital solution and RV residuals before (left panels) and after (right panels) the inclusion of activity in the global fit. The two upper panels: RV fit and its residuals for the inner planet, phased on its period, after removing the solution of the second planet. The two lower panels: RV fit as a function of time for the outer planet, after removing the solution of the inner one. Red and blue dots represent HARPS-N and TRES data, respectively. The gray shaded areas represent the 3σ confidence regions.
Current usage metrics show cumulative count of Article Views (full-text article views including HTML views, PDF and ePub downloads, according to the available data) and Abstracts Views on Vision4Press platform.
Data correspond to usage on the plateform after 2015. The current usage metrics is available 48-96 hours after online publication and is updated daily on week days.
Initial download of the metrics may take a while.