Fig. 2
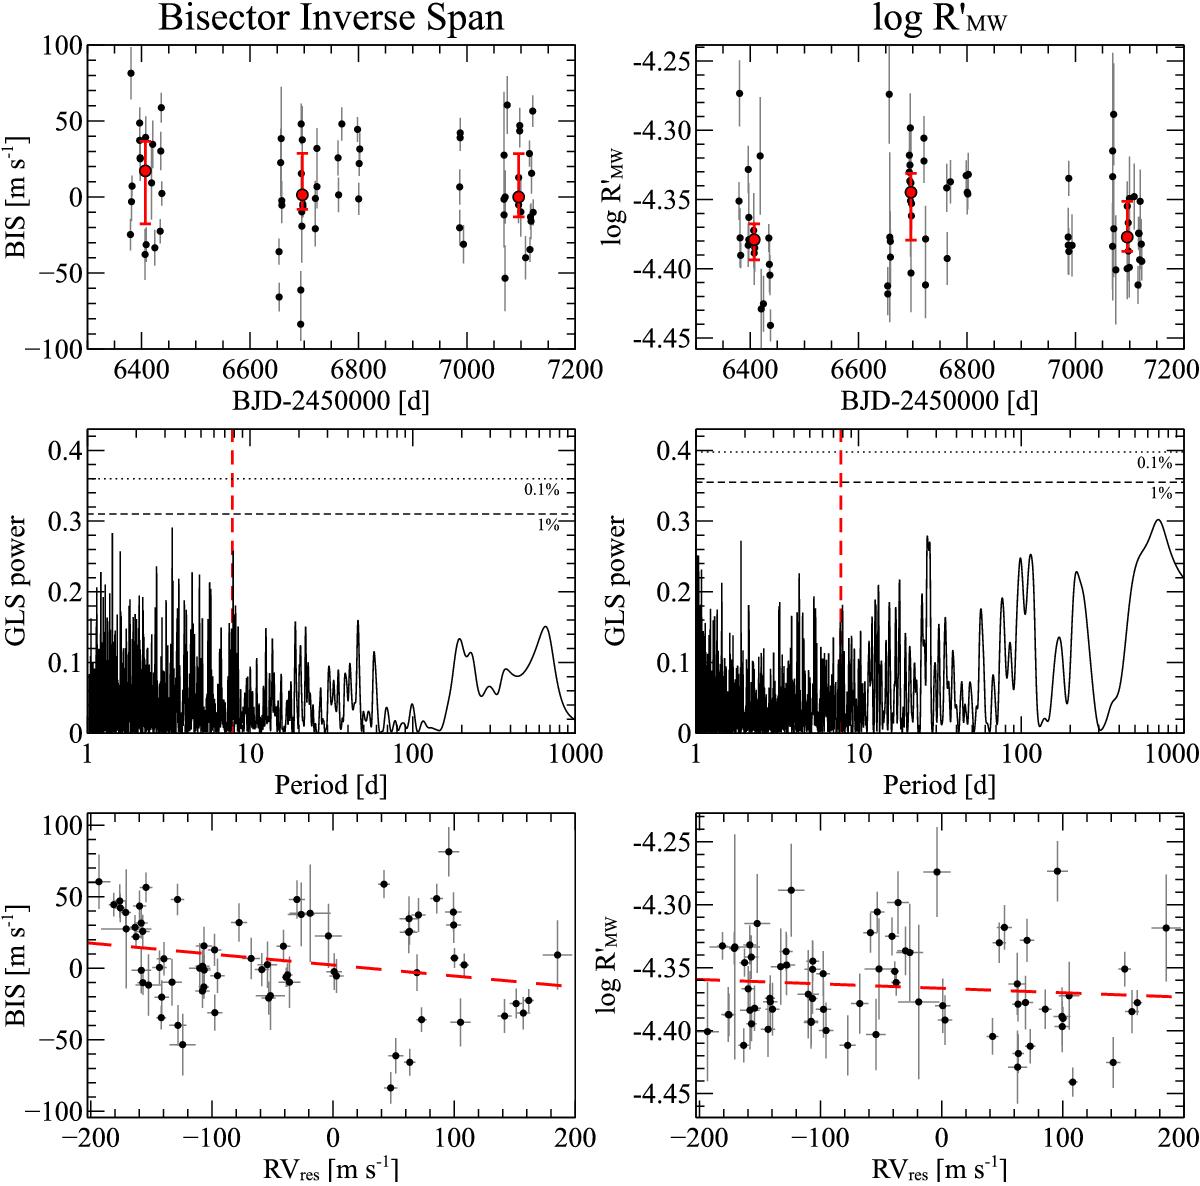
Analysis of the bisector inverse span (panels on the left side) and the ![]() index (panels on the right side). Upper panels: the indicators as a function of time, the seasonal medians with the first and third quartiles indicated in red. Middle panels: GLS periodograms of the indexes, the rotational period of the star is indicated with a red vertical line. The 1% and 0.1% FAP levels are displayed as dashed and dotted horizontal lines, respectively. Lower panels: indicators as a function of RV, after removing the signal of Pr 0211b. The best fit is represented by the dashed red line
index (panels on the right side). Upper panels: the indicators as a function of time, the seasonal medians with the first and third quartiles indicated in red. Middle panels: GLS periodograms of the indexes, the rotational period of the star is indicated with a red vertical line. The 1% and 0.1% FAP levels are displayed as dashed and dotted horizontal lines, respectively. Lower panels: indicators as a function of RV, after removing the signal of Pr 0211b. The best fit is represented by the dashed red line
Current usage metrics show cumulative count of Article Views (full-text article views including HTML views, PDF and ePub downloads, according to the available data) and Abstracts Views on Vision4Press platform.
Data correspond to usage on the plateform after 2015. The current usage metrics is available 48-96 hours after online publication and is updated daily on week days.
Initial download of the metrics may take a while.