Fig. 7
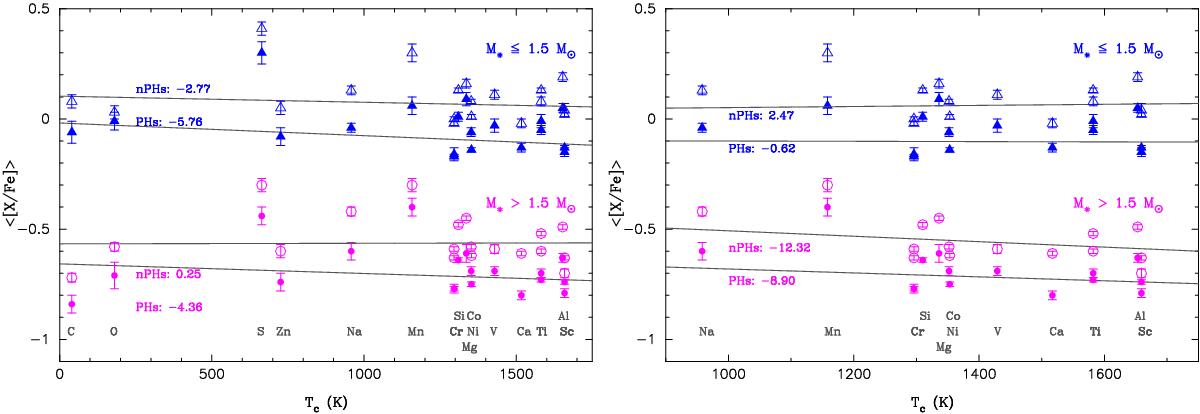
⟨[X/Fe]⟩-TC trends for giant stars. GWPs with M⋆> 1.5 M⊙ are plotted with purple circles, GWPs less massive than 1.5 M⊙ in blue triangles. Filled symbols indicate planet hosts. Each planet host subsample is shown against its corresponding comparison subsample with an offset of –0.15 for the sake of clarity. The offset between the sample of giants with M⋆> 1.5 M⊙ and less massive giants is –0.75. For guidance, the derived slopes are shown in the plots (units of 10-5 dex/K). The left panel shows the ⟨[X/Fe]⟩-TC trends when all elements (volatiles and refractories) are taken into account, whilst the one on the right shows the ⟨[X/Fe]⟩-TC trends when only refractories are considered.
Current usage metrics show cumulative count of Article Views (full-text article views including HTML views, PDF and ePub downloads, according to the available data) and Abstracts Views on Vision4Press platform.
Data correspond to usage on the plateform after 2015. The current usage metrics is available 48-96 hours after online publication and is updated daily on week days.
Initial download of the metrics may take a while.