Fig. 4
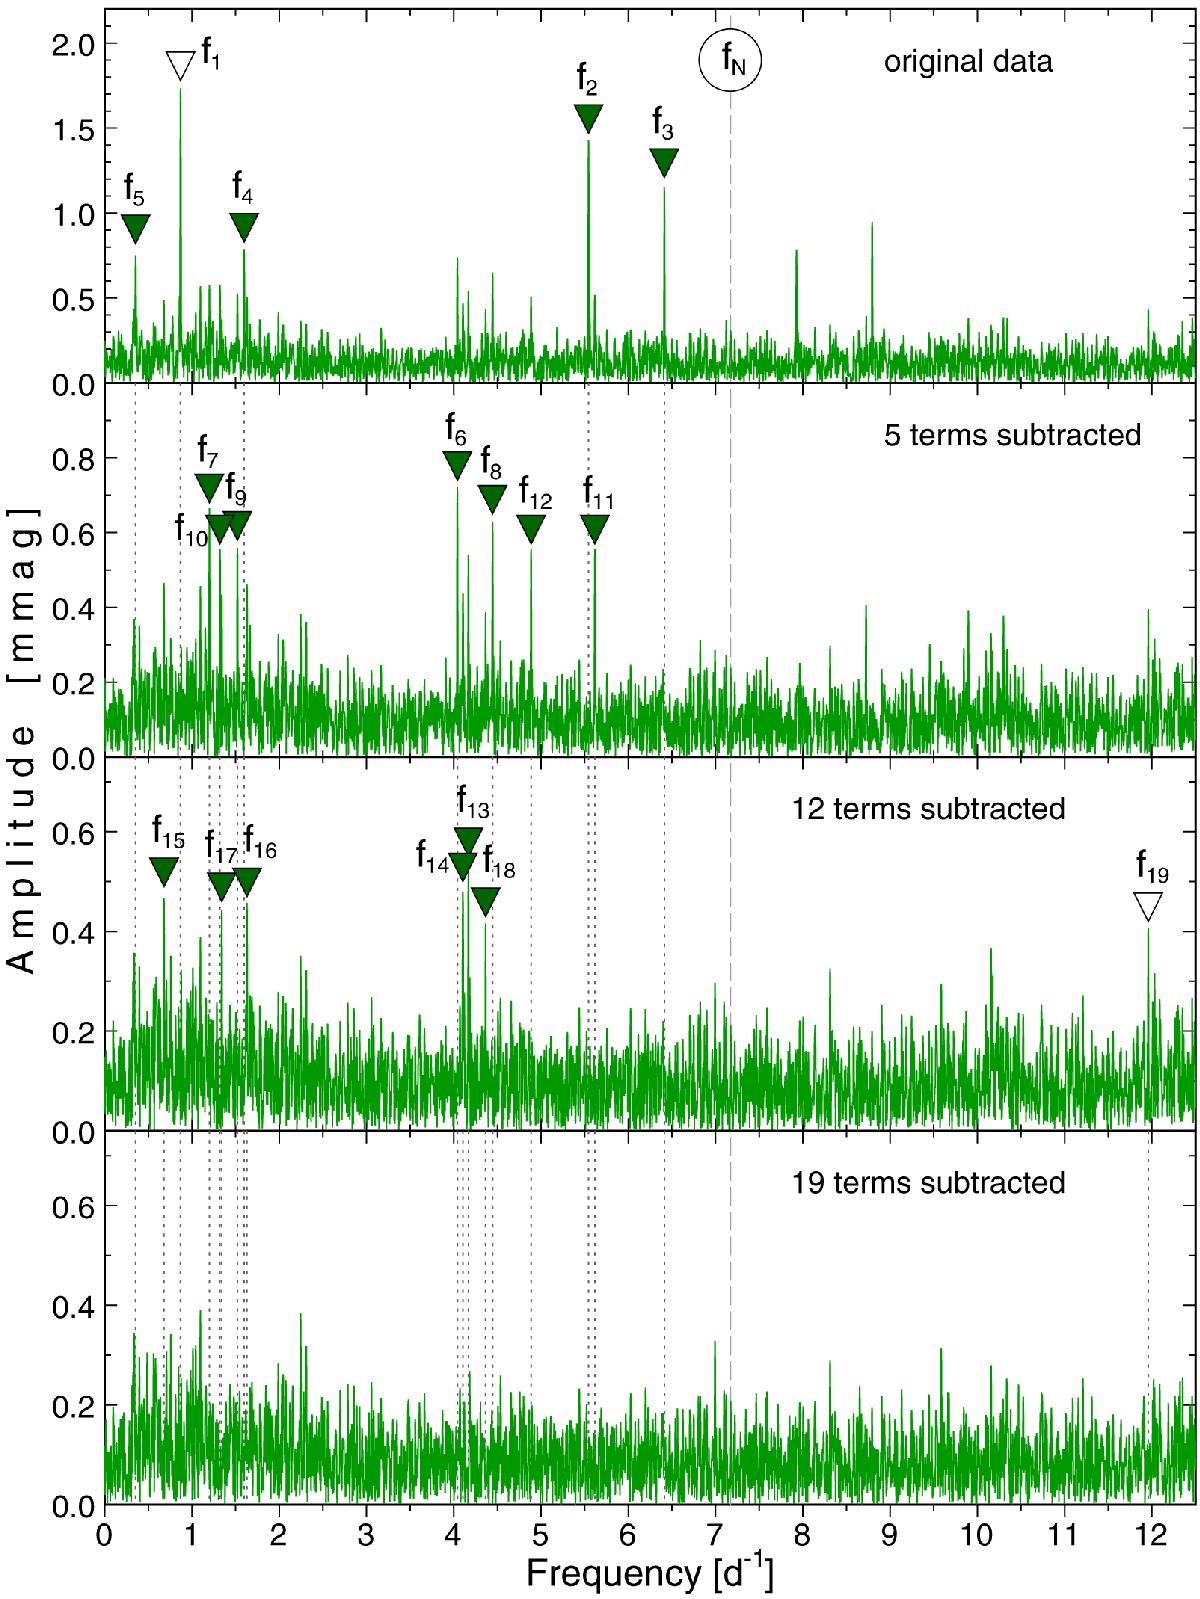
Fourier frequency spectra for the combined blue- and red-filter B-C data of β Cen at four steps of the pre-whitening procedure. The detected terms are marked with inverted triangles and labeled from f1 to f19. The open triangles for f1 and f19 indicate combination frequencies. fN ≈ 7.17 d-1 stands for the Nyquist frequency related to the orbital sampling and is marked with a dashed line. The dotted vertical lines indicate frequencies of terms that were subtracted. Note the different ordinate scales in different panels.
Current usage metrics show cumulative count of Article Views (full-text article views including HTML views, PDF and ePub downloads, according to the available data) and Abstracts Views on Vision4Press platform.
Data correspond to usage on the plateform after 2015. The current usage metrics is available 48-96 hours after online publication and is updated daily on week days.
Initial download of the metrics may take a while.