Fig. 3
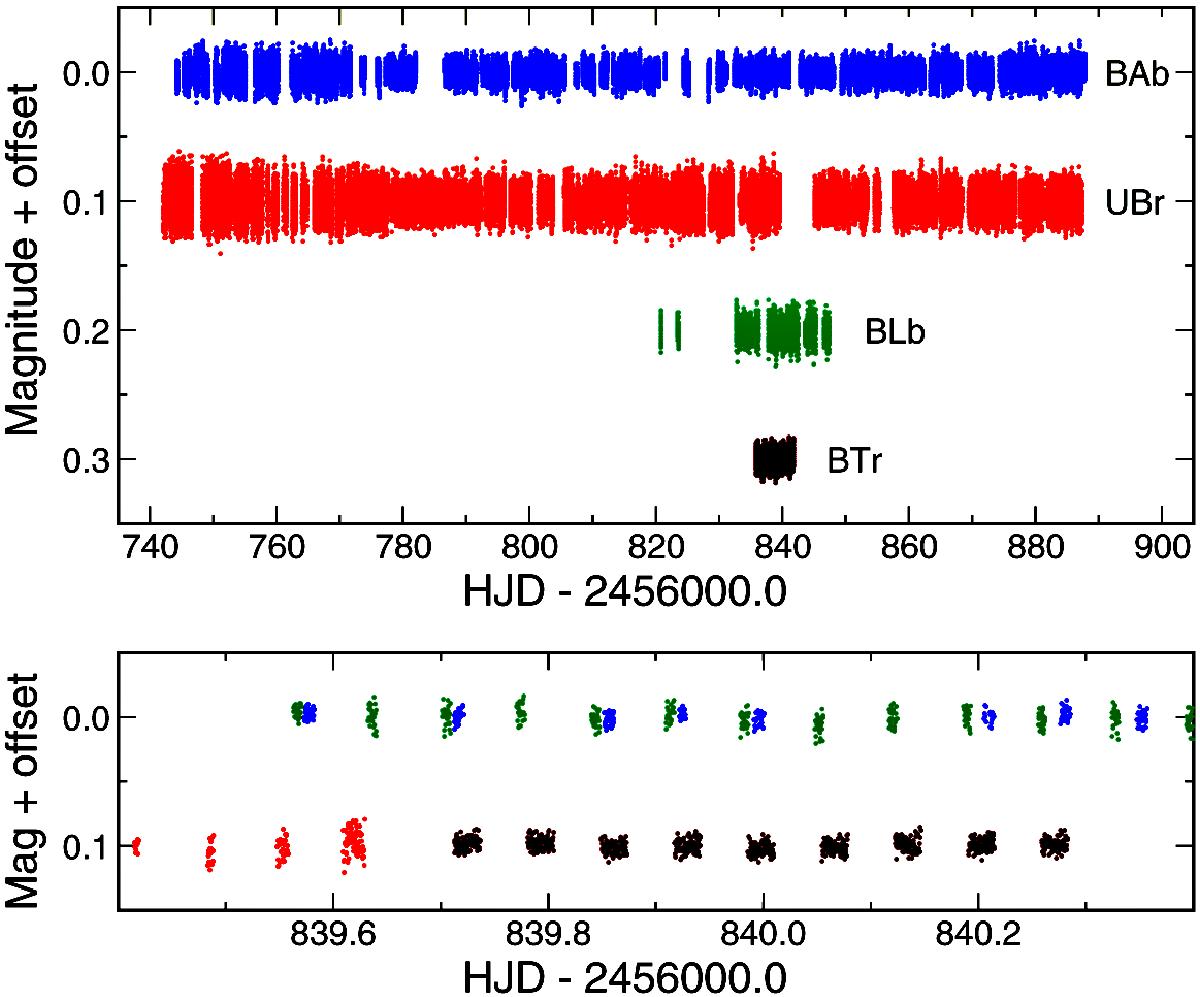
Top: distribution of BRITE data of β Cen from four BRITE satellites. Offsets have been applied to separate the light curves. Bottom: a 1-day series of BRITE observations of β Cen. Note groups of data points separated by the satellites’ orbital period of about 100 min (0.07 d). The same offsets have been applied to the blue-filter (BAb + BLb, upper sequence of points) and red-filter (UBr + BTr, lower sequence of points) data.
Current usage metrics show cumulative count of Article Views (full-text article views including HTML views, PDF and ePub downloads, according to the available data) and Abstracts Views on Vision4Press platform.
Data correspond to usage on the plateform after 2015. The current usage metrics is available 48-96 hours after online publication and is updated daily on week days.
Initial download of the metrics may take a while.