Press Release
Free Access
Fig. A.5
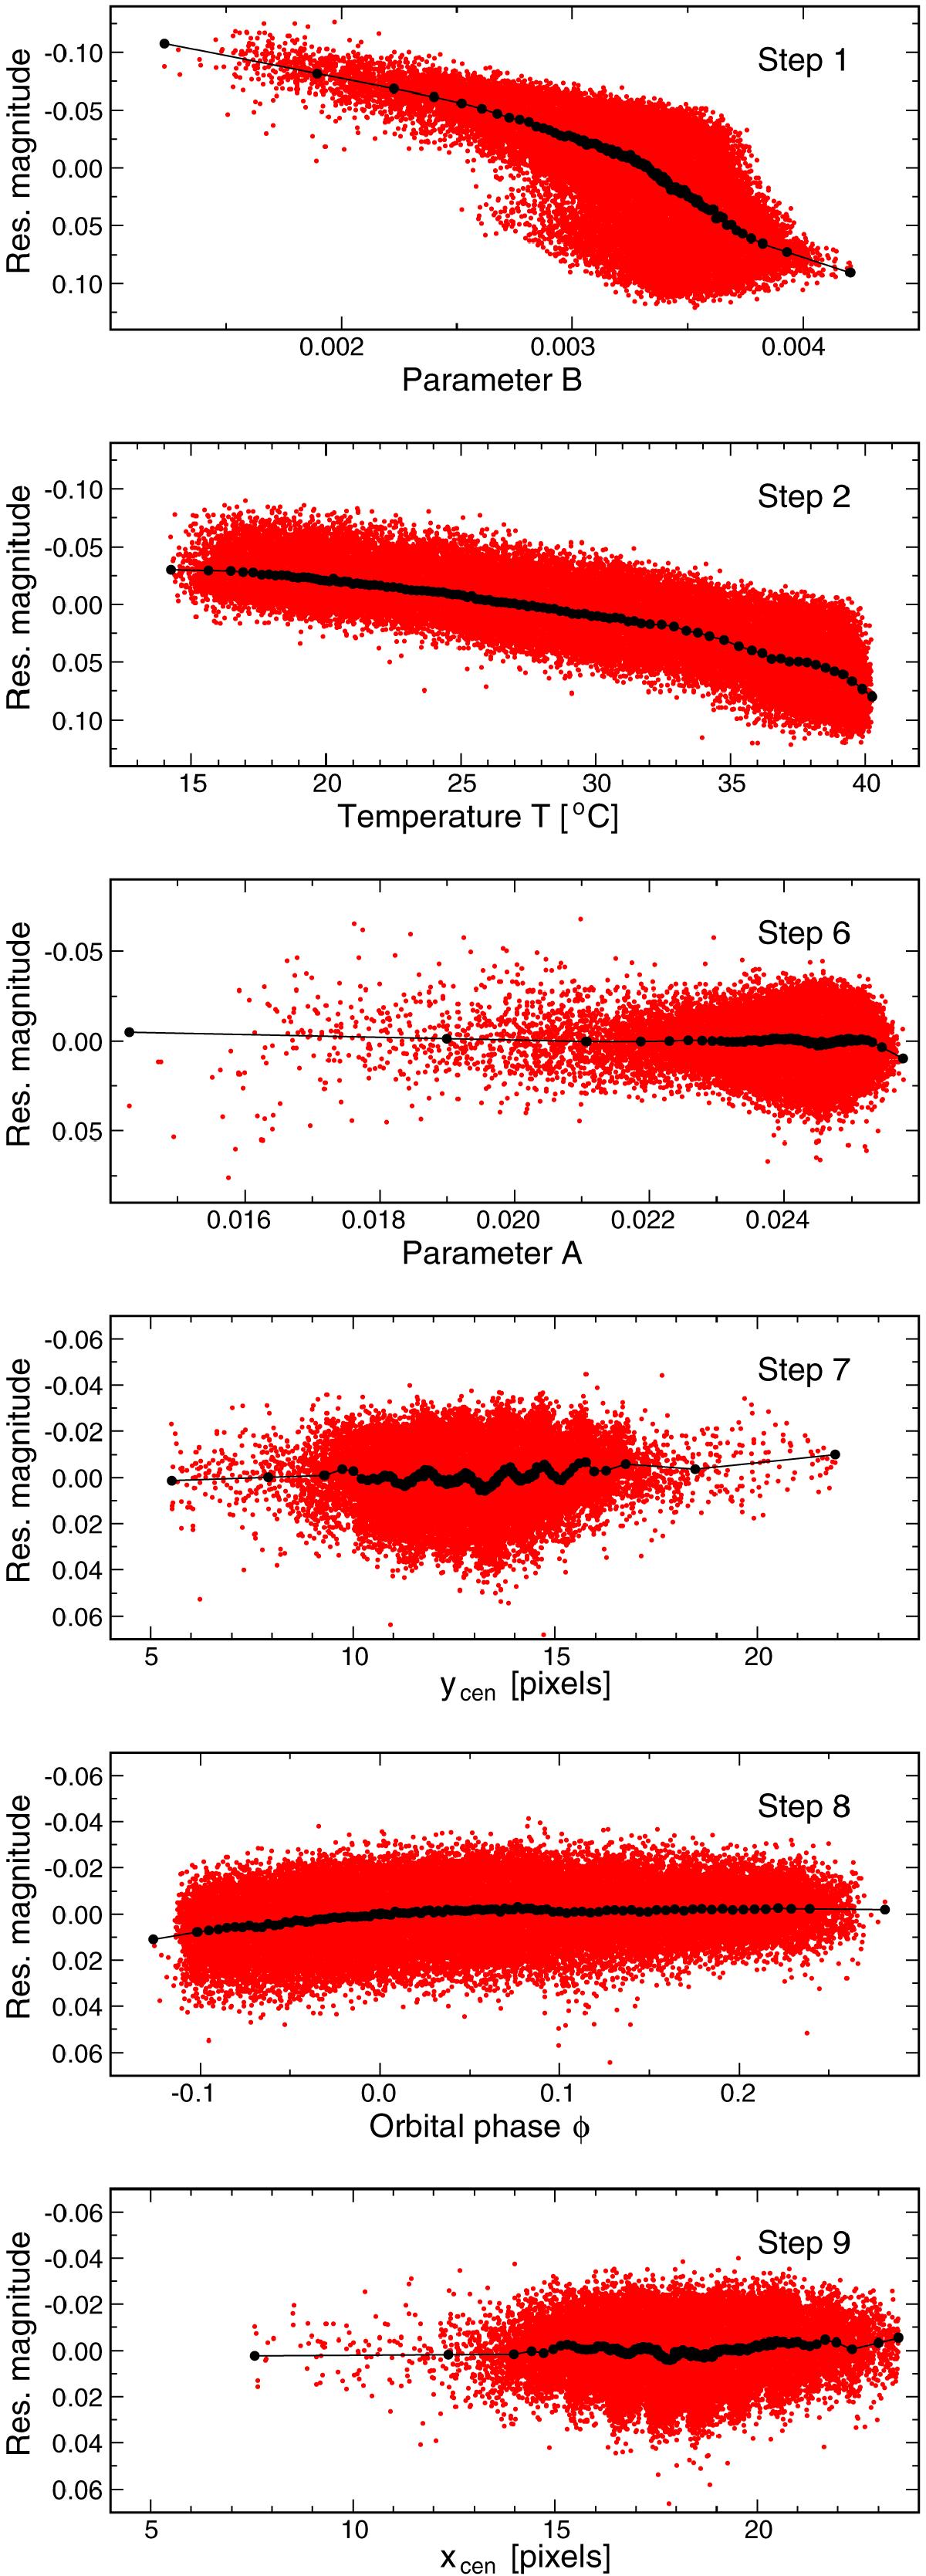
Six selected steps of decorrelation for the UBr data of β Cen. The panels show residual magnitude as a function of a given parameter (going from top to bottom, B, T, A, ycen, φ, and xcen). The black dots are the anchor points.
Current usage metrics show cumulative count of Article Views (full-text article views including HTML views, PDF and ePub downloads, according to the available data) and Abstracts Views on Vision4Press platform.
Data correspond to usage on the plateform after 2015. The current usage metrics is available 48-96 hours after online publication and is updated daily on week days.
Initial download of the metrics may take a while.