Fig. A.2
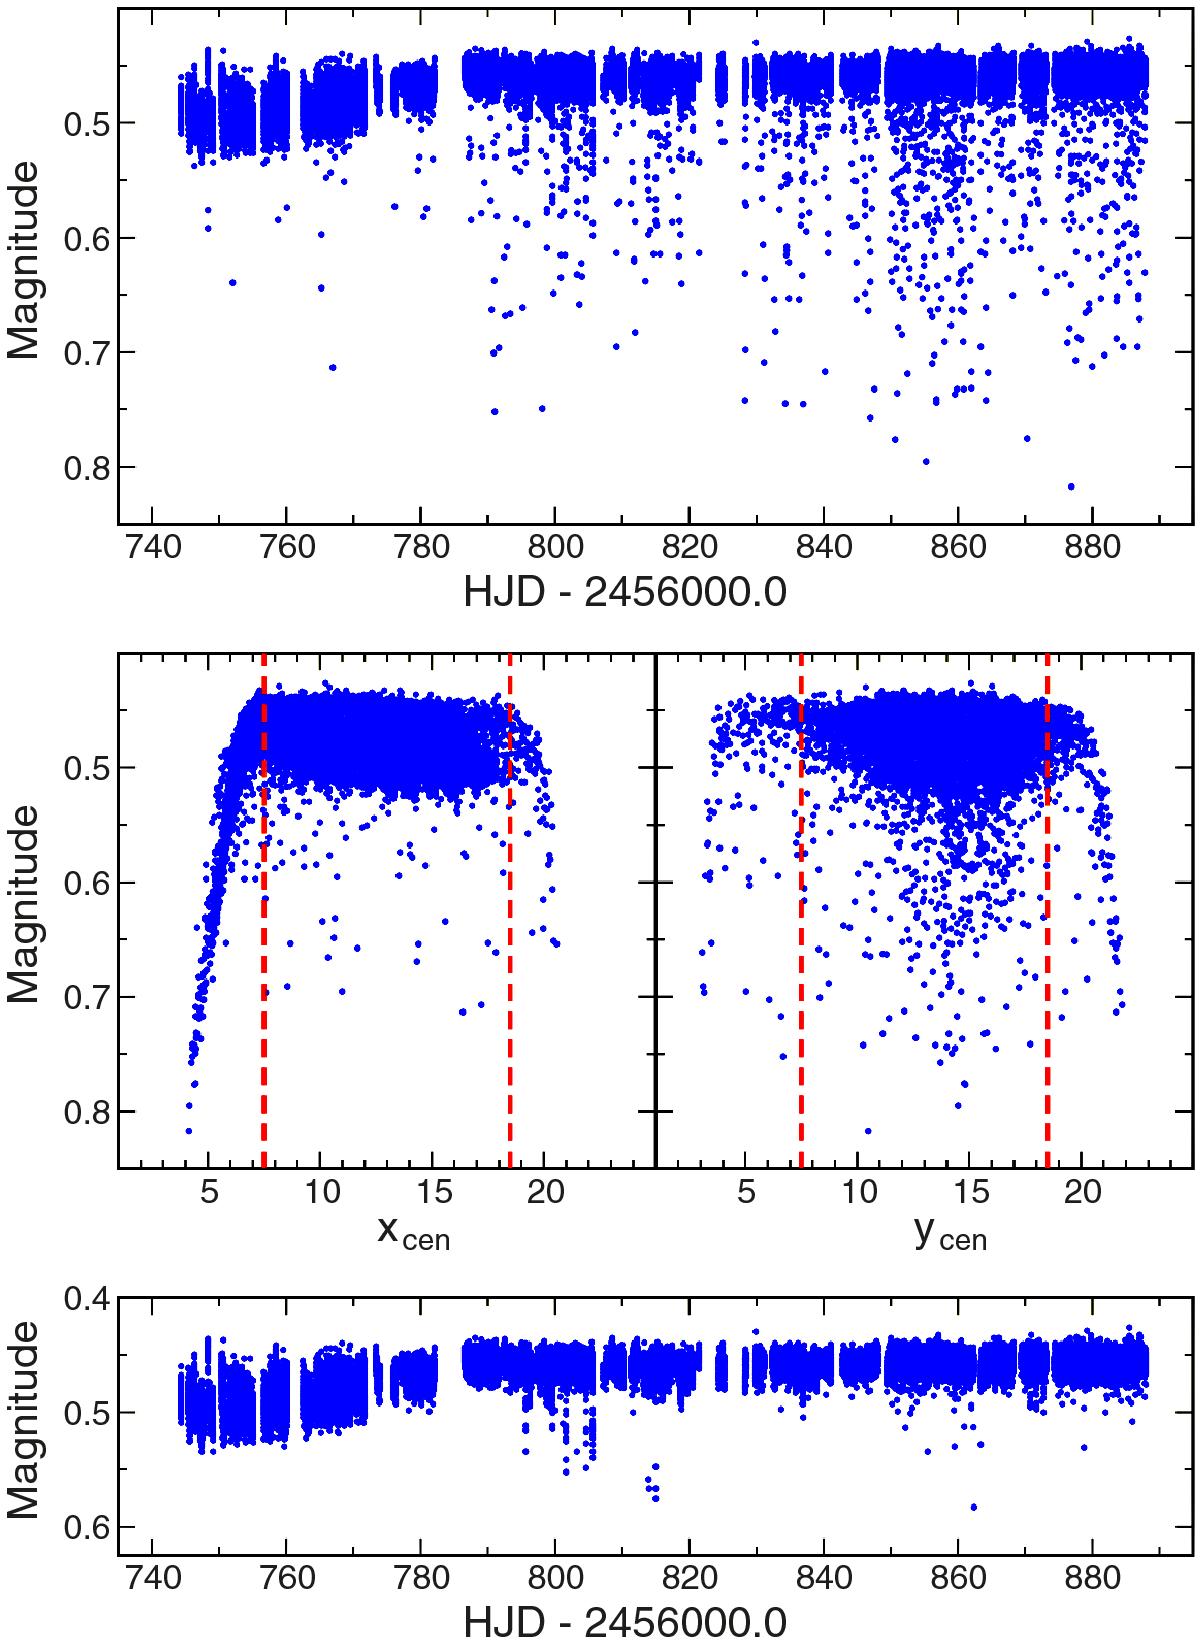
Top: the raw BAb light curve of β Cen. Middle: raw magnitudes plotted as a function of xcen (left) and ycen (right). Vertical dashed lines encompass the ranges of xcen and ycen in which the raster fully includes the optimal aperture. Bottom: the BAb light curve of β Cen after removing data points that come from frames with aperture extending beyond the raster edge.
Current usage metrics show cumulative count of Article Views (full-text article views including HTML views, PDF and ePub downloads, according to the available data) and Abstracts Views on Vision4Press platform.
Data correspond to usage on the plateform after 2015. The current usage metrics is available 48-96 hours after online publication and is updated daily on week days.
Initial download of the metrics may take a while.