Fig. 1
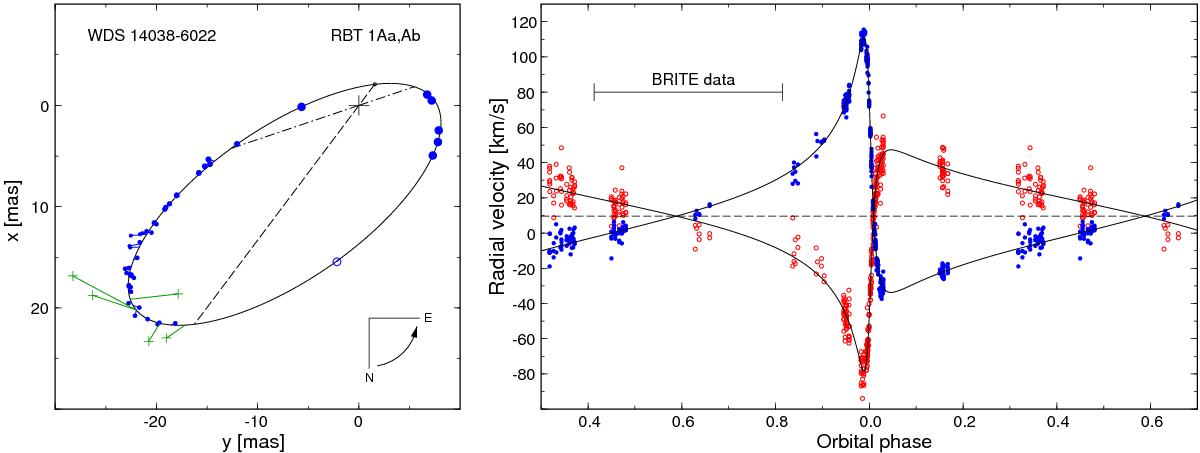
Left: visual orbit of the Aa–Ab components of β Cen. The MAPPIT observation is plotted as an open circle, speckle data with plus signs, SUSI observations with filled circles. For the last observations, the larger the symbol, the larger the weight that was adopted. The line of apsides is plotted with a dashed line, the line of nodes with a dash-dotted line. The designation of x and y follows the common double-star convention (Heintz 1978). Right: radial velocity curves for both components, filtered to remove any high-frequency contribution (red open circles for primary and blue filled circles for secondary), compared to the solution from combined visual and spectroscopic data (continuous lines). Phase 0.0 corresponds to T0. The span of the B-C data is also shown.
Current usage metrics show cumulative count of Article Views (full-text article views including HTML views, PDF and ePub downloads, according to the available data) and Abstracts Views on Vision4Press platform.
Data correspond to usage on the plateform after 2015. The current usage metrics is available 48-96 hours after online publication and is updated daily on week days.
Initial download of the metrics may take a while.