Fig. 4
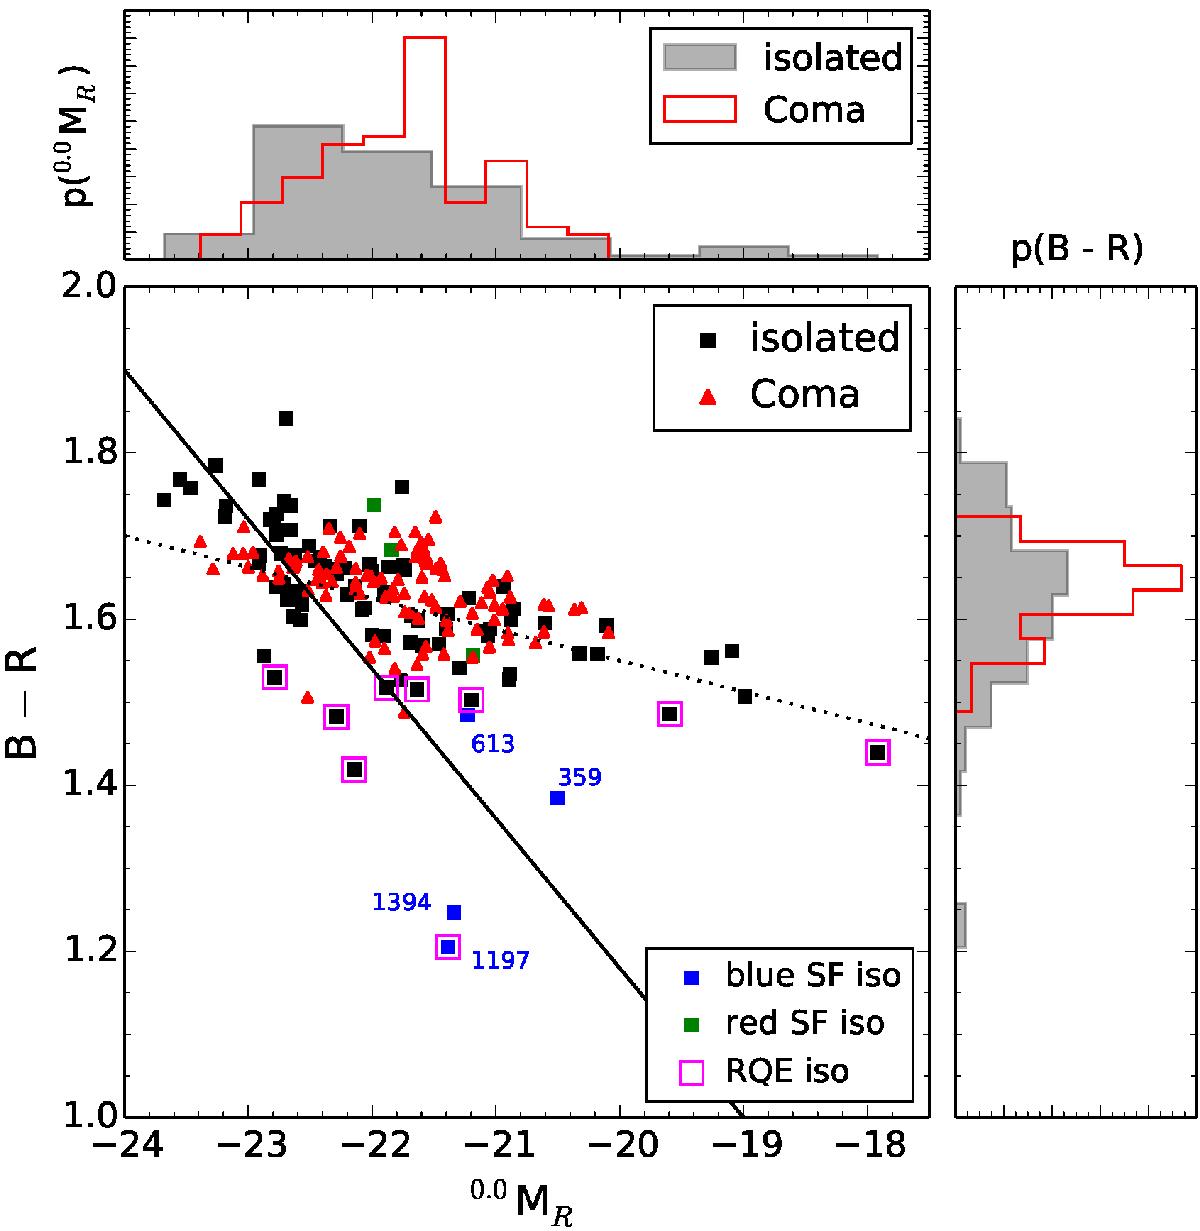
B−R color as a function of the absolute magnitude in the R-band (h = 0.7, K-corrected at z = 0). The symbols for the galaxies are the same as Fig. 2. The linear fit of Niemi et al. (2010) for their (nonisolated) elliptical galaxies from a semianalytic model is shown as a dotted line. The fit for their simulated isolated elliptical galaxies is shown as a solid line. Top and right panels: normalized density distributions of absolute magnitude and B−R color for isolated elliptical galaxies (gray solid histogram) and elliptical galaxies located in the Coma supercluster (red open histogram), respectively. The integral of each histogram sums to unity.
Current usage metrics show cumulative count of Article Views (full-text article views including HTML views, PDF and ePub downloads, according to the available data) and Abstracts Views on Vision4Press platform.
Data correspond to usage on the plateform after 2015. The current usage metrics is available 48-96 hours after online publication and is updated daily on week days.
Initial download of the metrics may take a while.