Fig. A.1
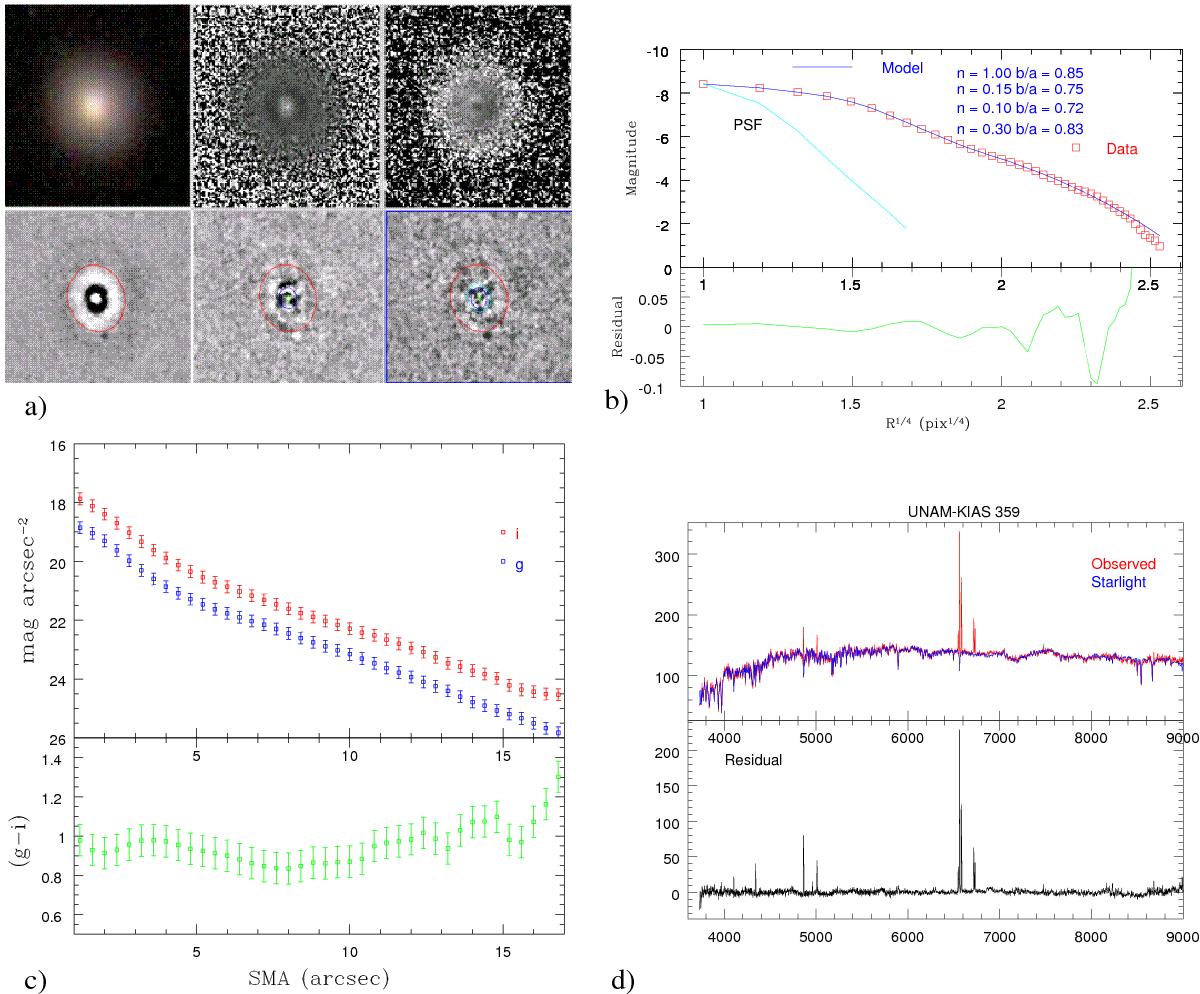
Analysis for the blue SF galaxy UNAM-KIAS 359. Top-left panels a): first row shows (from left to right) the SDSS gri-band color image, filter-enhanced r-band image, and g−i color map. Second row shows (from left to right) residual r-band images from Sérsic1, Sérsic2, and Sérsic3 models. The red ellipse shows the geometric parameters for one Sersic component, whereas additional components are shown in blue, green, and cyan ellipses if they correspond. Top-right panels b): azimuthally averaged surface brightness distribution (red squares) and that derived from the best Sérsic components model (blue line). PSF modeling of field stars is shown as a cyan line. The residual comparison is shown in the lower box (green line). Bottom-left panels c): surface brightness profile in the bands g and i (blue and red squares, respectively). The g−i color gradient is shown in the lower box. Bottom-right panels d): observed SDSS spectrum (red line) along with the corresponding modeled population synthesis spectrum (blue line). The residual spectrum is shown in the lower box (black line).
Current usage metrics show cumulative count of Article Views (full-text article views including HTML views, PDF and ePub downloads, according to the available data) and Abstracts Views on Vision4Press platform.
Data correspond to usage on the plateform after 2015. The current usage metrics is available 48-96 hours after online publication and is updated daily on week days.
Initial download of the metrics may take a while.