Free Access
Fig. 1
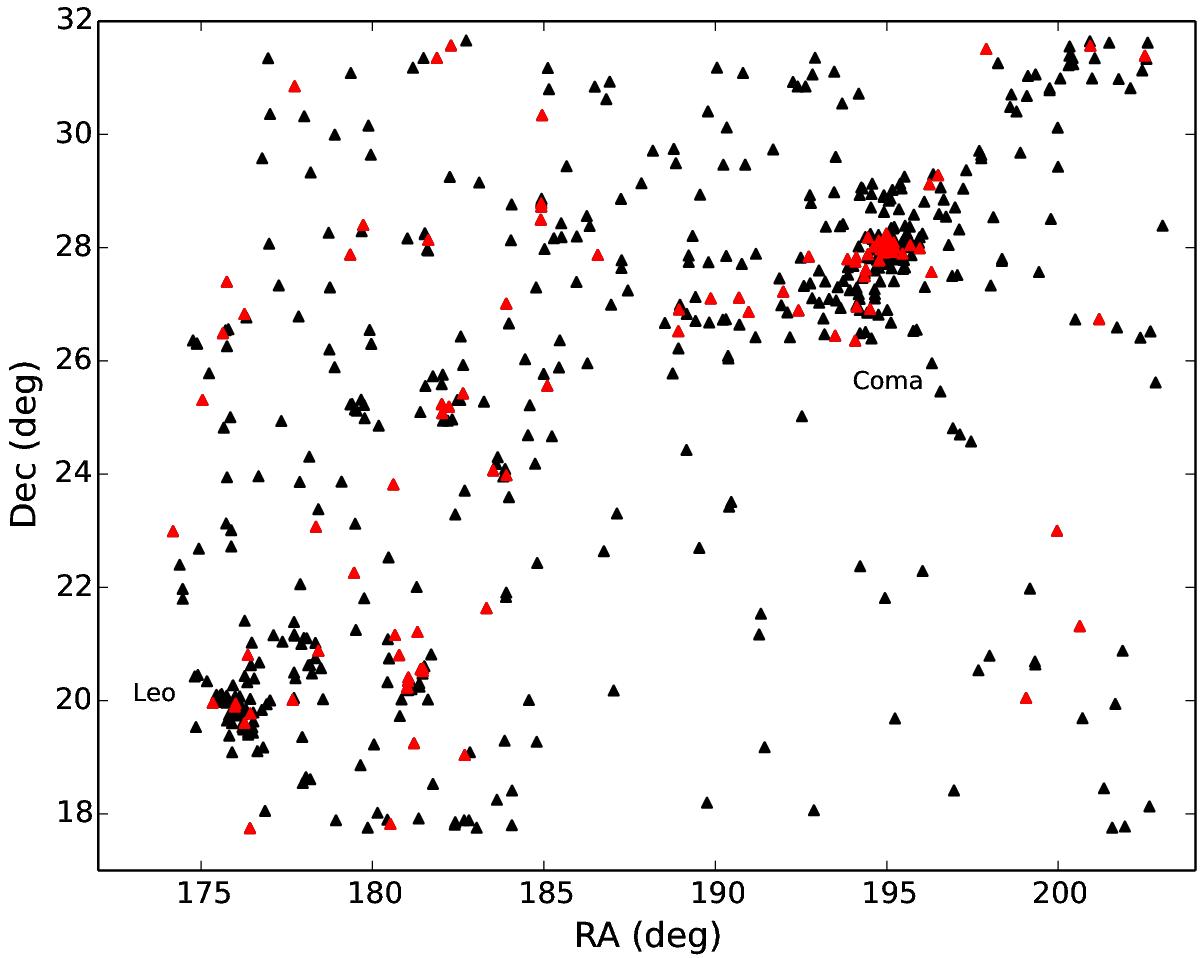
Distribution in right ascension and declination of galaxies in the Coma supercluster with spectroscopic redshifts in the range 4000 < cz < 9500 km s-1. Red points correspond to elliptical galaxies. Coma and Leo clusters (Abell 1656 and Abell 1367, respectively) are indicated in the plot.
Current usage metrics show cumulative count of Article Views (full-text article views including HTML views, PDF and ePub downloads, according to the available data) and Abstracts Views on Vision4Press platform.
Data correspond to usage on the plateform after 2015. The current usage metrics is available 48-96 hours after online publication and is updated daily on week days.
Initial download of the metrics may take a while.