Free Access
Fig. 9
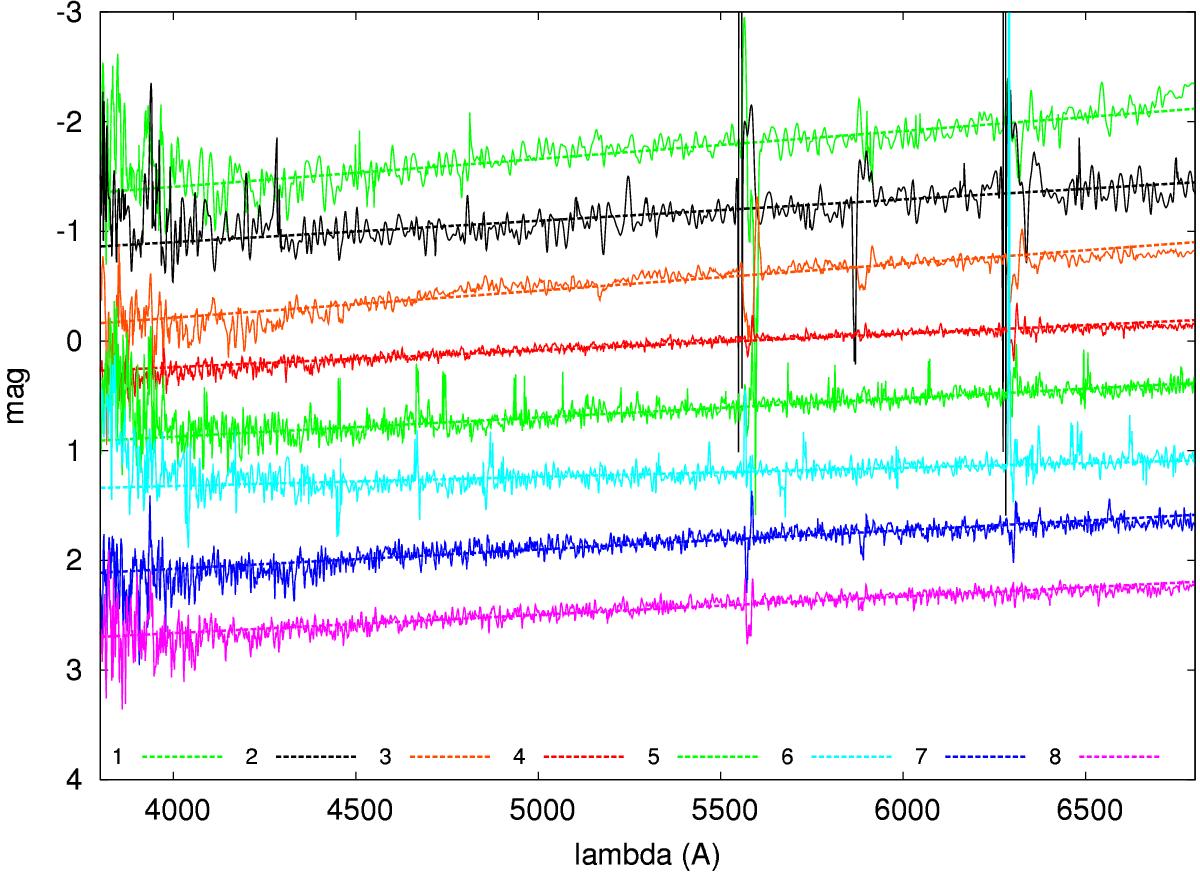
Average FORS spectra for each run (numbers 1−8 refer to the FORS runs in Table 2 in chronological order), divided by solar spectrum. The y axis is in simple magnitudes (−2.5log f) with arbitrary zero-points added to offset the spectra.
Current usage metrics show cumulative count of Article Views (full-text article views including HTML views, PDF and ePub downloads, according to the available data) and Abstracts Views on Vision4Press platform.
Data correspond to usage on the plateform after 2015. The current usage metrics is available 48-96 hours after online publication and is updated daily on week days.
Initial download of the metrics may take a while.