Fig. 6
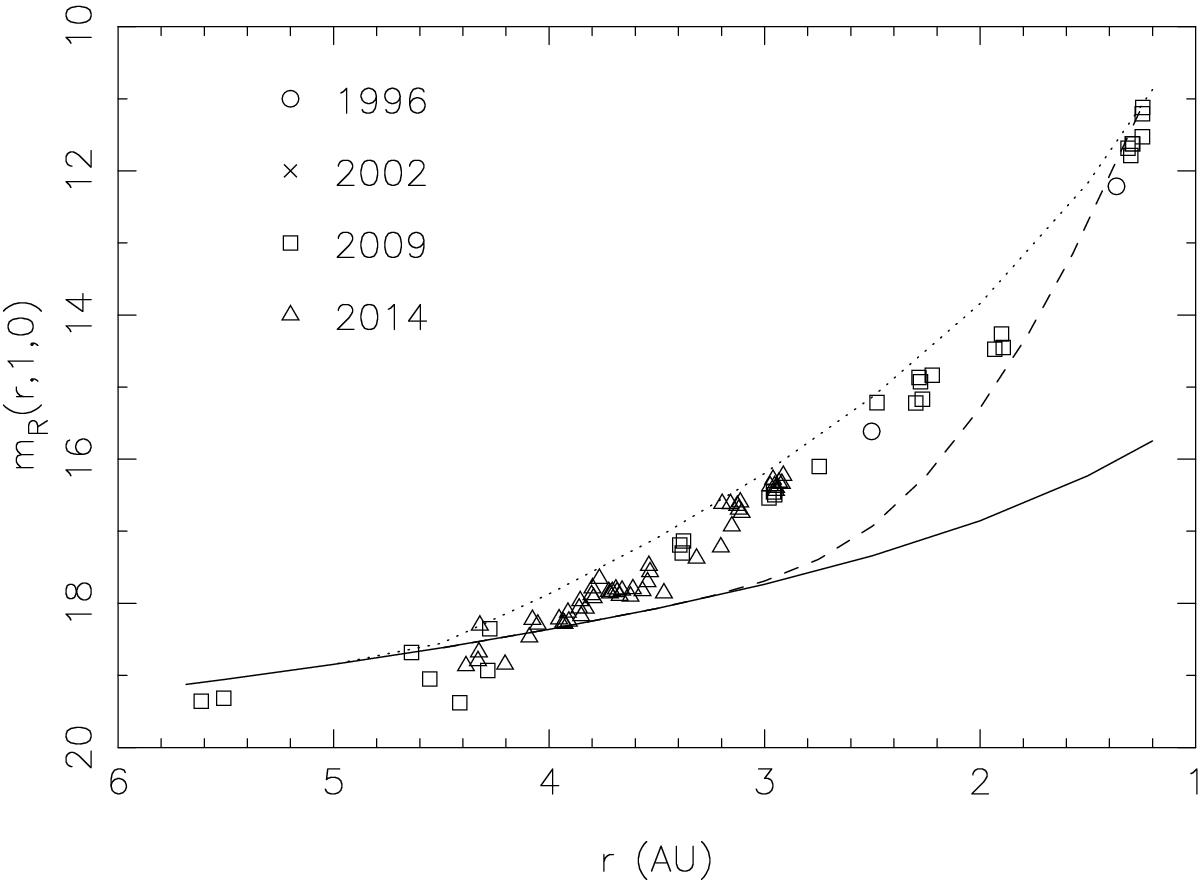
Heliocentric light-curve (pre-perihelion only), showing 2014 photometry compared with models (solid line = bare nucleus; dotted line = fit to previous dust photometry; dashed line = predicted brightness from expected water production) and previous data from Snodgrass et al. (2013). See Fig. 6 in that paper for further details.
Current usage metrics show cumulative count of Article Views (full-text article views including HTML views, PDF and ePub downloads, according to the available data) and Abstracts Views on Vision4Press platform.
Data correspond to usage on the plateform after 2015. The current usage metrics is available 48-96 hours after online publication and is updated daily on week days.
Initial download of the metrics may take a while.