Free Access
Fig. 12
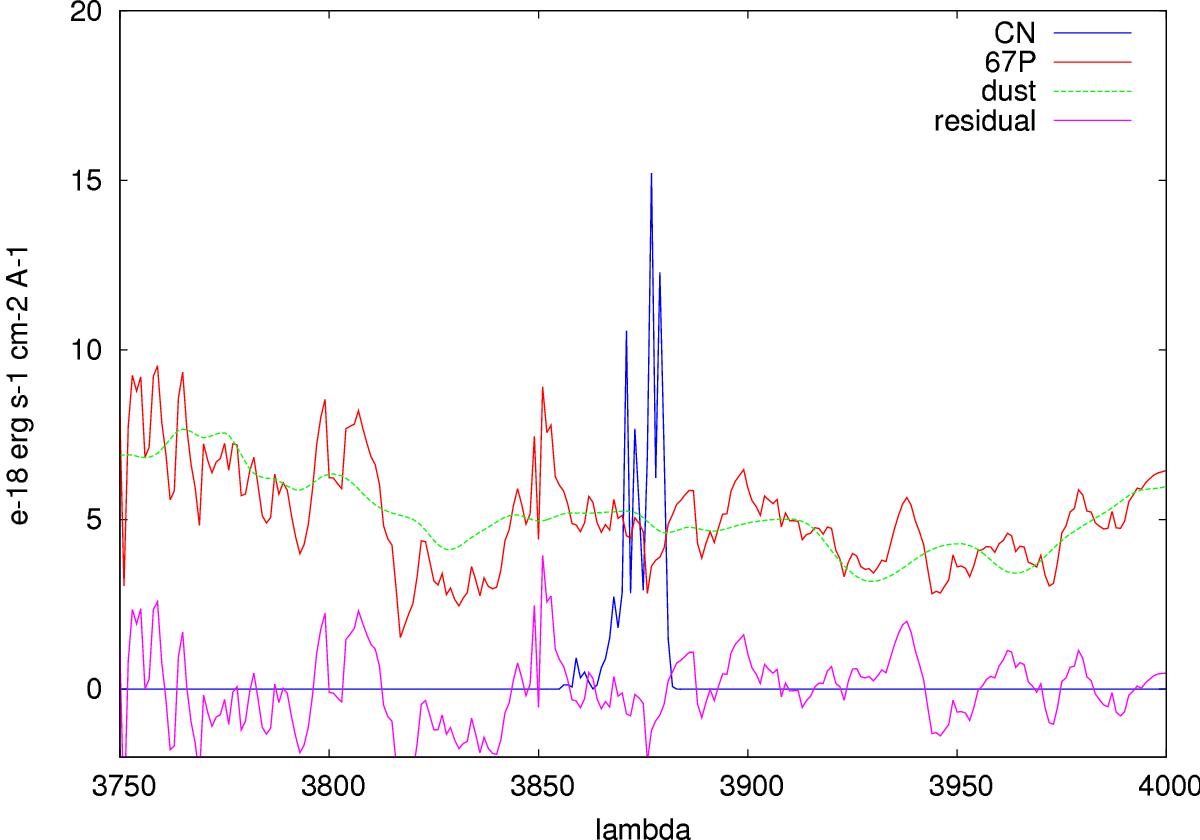
Zoom in on the region around the CN emission band for the FORS spectrum shown in Fig. 11. Here the comet spectrum is shown in red, the scaled solar analog in green, and the residual after subtracting this in pink, compared with a theoretical CN emission band for Q(CN) = 5 × 10²³ molec s-1 (blue).
Current usage metrics show cumulative count of Article Views (full-text article views including HTML views, PDF and ePub downloads, according to the available data) and Abstracts Views on Vision4Press platform.
Data correspond to usage on the plateform after 2015. The current usage metrics is available 48-96 hours after online publication and is updated daily on week days.
Initial download of the metrics may take a while.