Free Access
Fig. 11
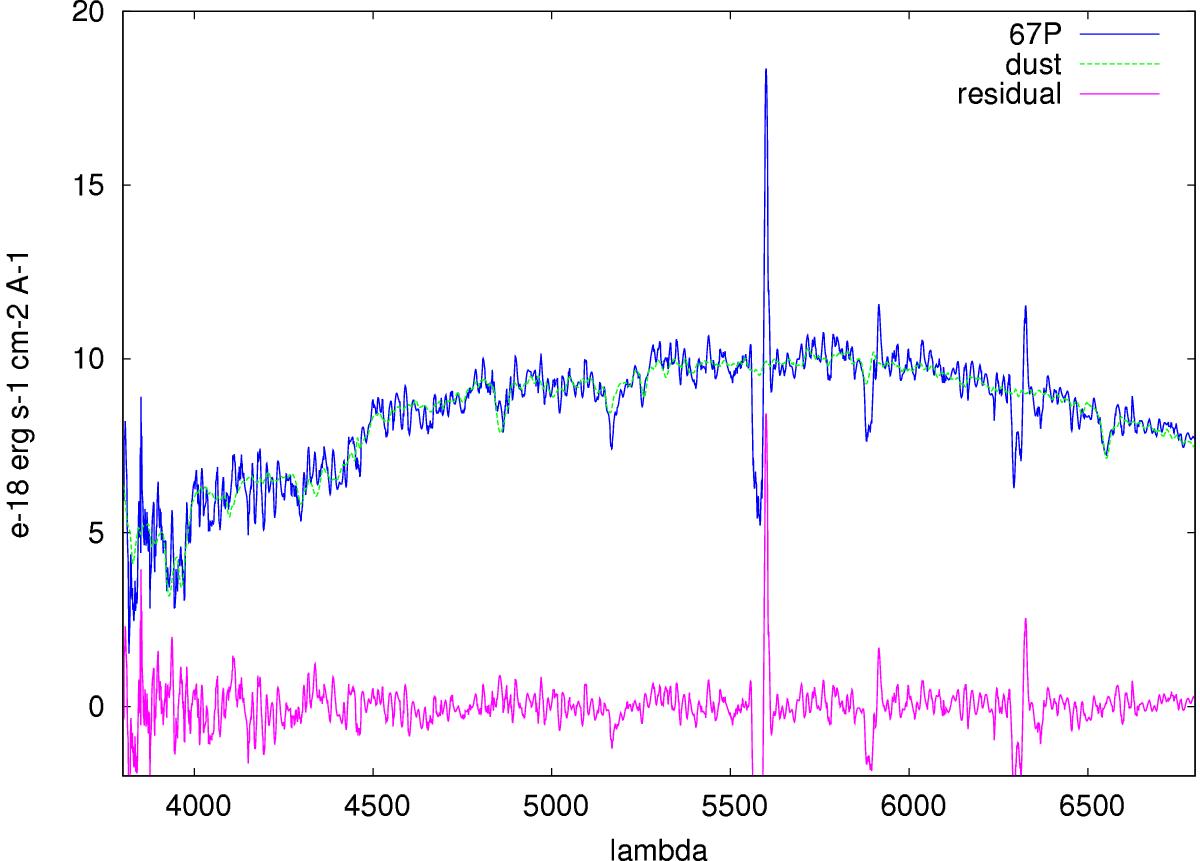
Example FORS spectrum (average of all individual spectra from the night of June 24th), showing the comet spectrum (blue), the scaled solar analog (green) and the residual after subtracting this (pink). The larger spikes are residual telluric lines not completely removed by the sky subtraction.
Current usage metrics show cumulative count of Article Views (full-text article views including HTML views, PDF and ePub downloads, according to the available data) and Abstracts Views on Vision4Press platform.
Data correspond to usage on the plateform after 2015. The current usage metrics is available 48-96 hours after online publication and is updated daily on week days.
Initial download of the metrics may take a while.