Free Access
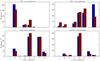
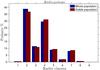
Fig. 3

Recurrence of the shape classes described in Tables 2 and 3 and shown in Tables A.1 and A.2 for the γ-ray pulsars (top panels), radio pulsars (bottom panel), and each model for the whole simulated pulsar population and its visible subsample, as synthesised by Pierbattista et al. (2012).
This figure is made of several images, please see below:
Current usage metrics show cumulative count of Article Views (full-text article views including HTML views, PDF and ePub downloads, according to the available data) and Abstracts Views on Vision4Press platform.
Data correspond to usage on the plateform after 2015. The current usage metrics is available 48-96 hours after online publication and is updated daily on week days.
Initial download of the metrics may take a while.