Fig. B.1
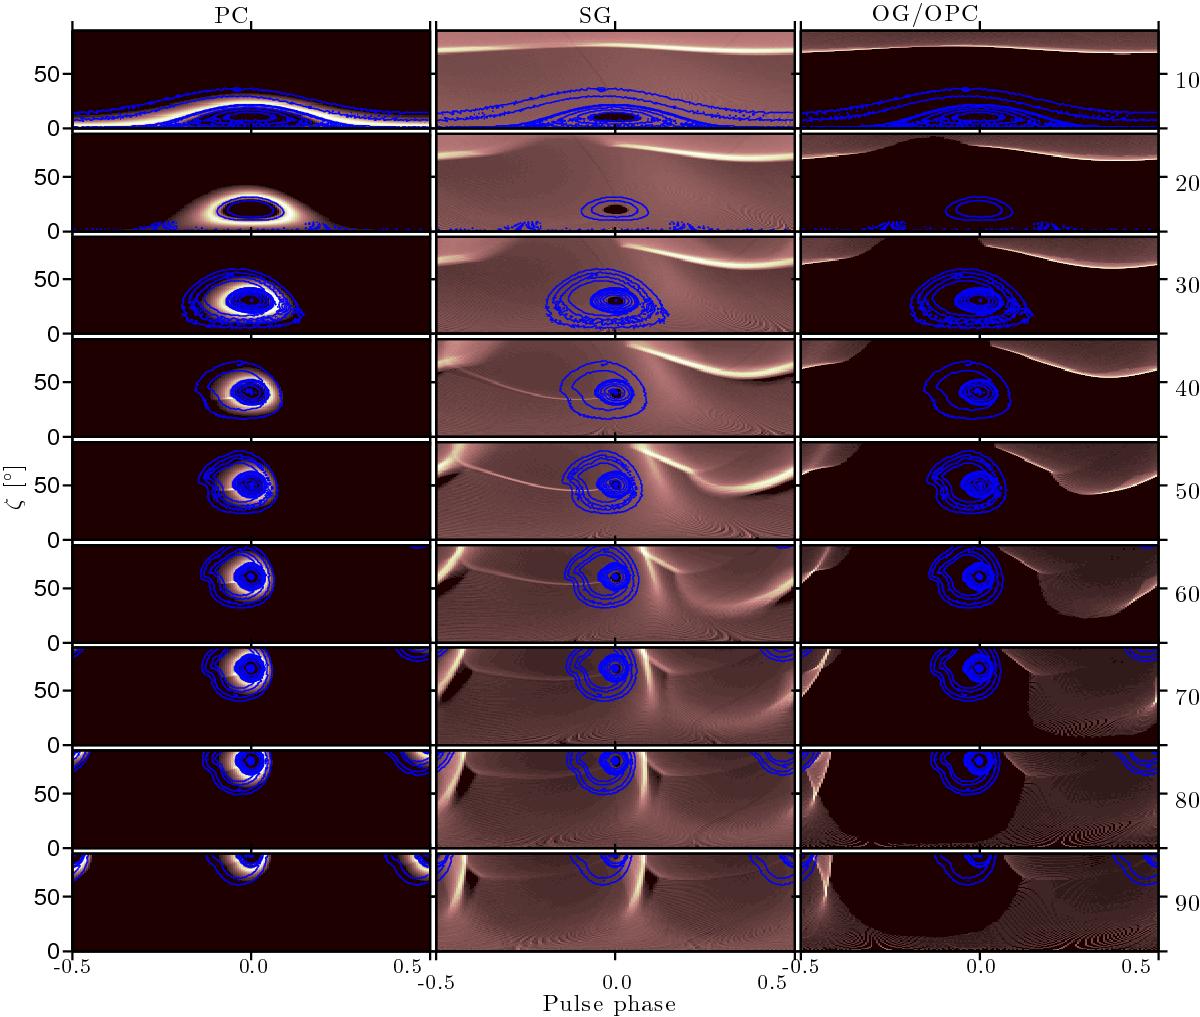
For each γ-ray emission model, the pulsar γ-ray (shaded surface) and radio (blue contours) emission patterns (phase plots) as a function of magnetic obliquity α, are shown. Each phase-plot panel gives the pulsar light curve as a function of the observer line-of-sight ζ for each α value stepped every 10° in the interval 0°<α< 90°. The γ-ray and radio phase plots have been obtained for a magnetic field strength of 108 Tesla and spin period of 30 ms for the PC and radio cases, and gap widths of 0.04 and 0.01 for the SG and OG/OPC cases, respectively.
Current usage metrics show cumulative count of Article Views (full-text article views including HTML views, PDF and ePub downloads, according to the available data) and Abstracts Views on Vision4Press platform.
Data correspond to usage on the plateform after 2015. The current usage metrics is available 48-96 hours after online publication and is updated daily on week days.
Initial download of the metrics may take a while.