Fig. A.1
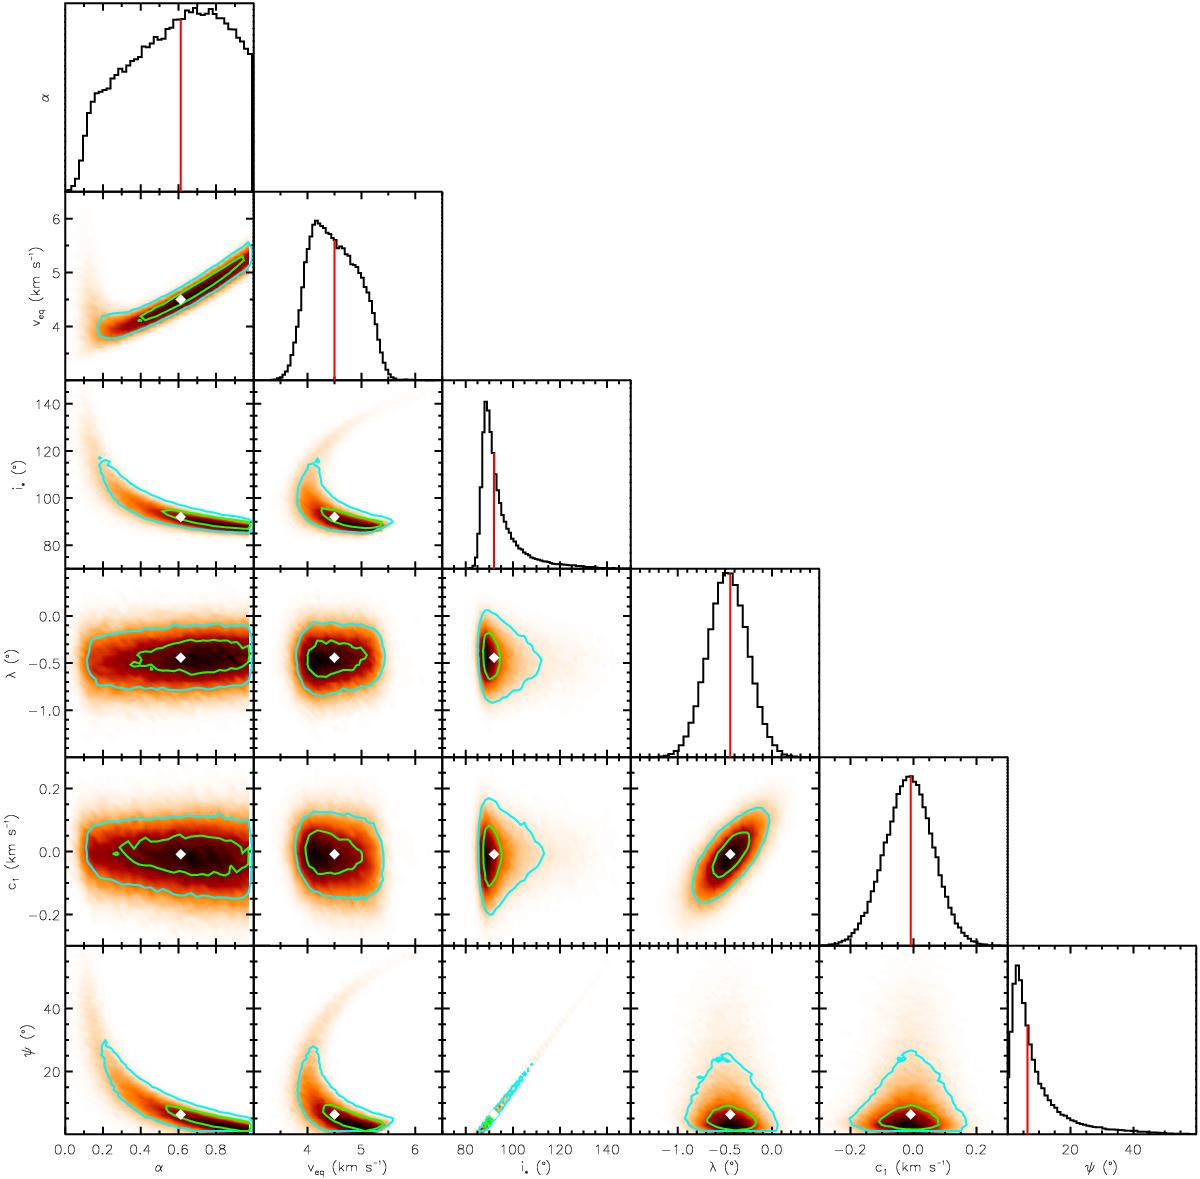
Correlation diagrams for the probability distributions of the vtot model parameters, for the first order vconv function. Green and blue lines show the 1 and 2σ simultaneous 2D confidence regions that contain respectively 39.3% and 86.5% of the accepted steps. 1D histograms correspond to the distributions projected on the space of each line parameter. The red line and white point show median values. Note ψ is derived from Eq. (14) and is not an MCMC jump parameter.
Current usage metrics show cumulative count of Article Views (full-text article views including HTML views, PDF and ePub downloads, according to the available data) and Abstracts Views on Vision4Press platform.
Data correspond to usage on the plateform after 2015. The current usage metrics is available 48-96 hours after online publication and is updated daily on week days.
Initial download of the metrics may take a while.