Fig. 8
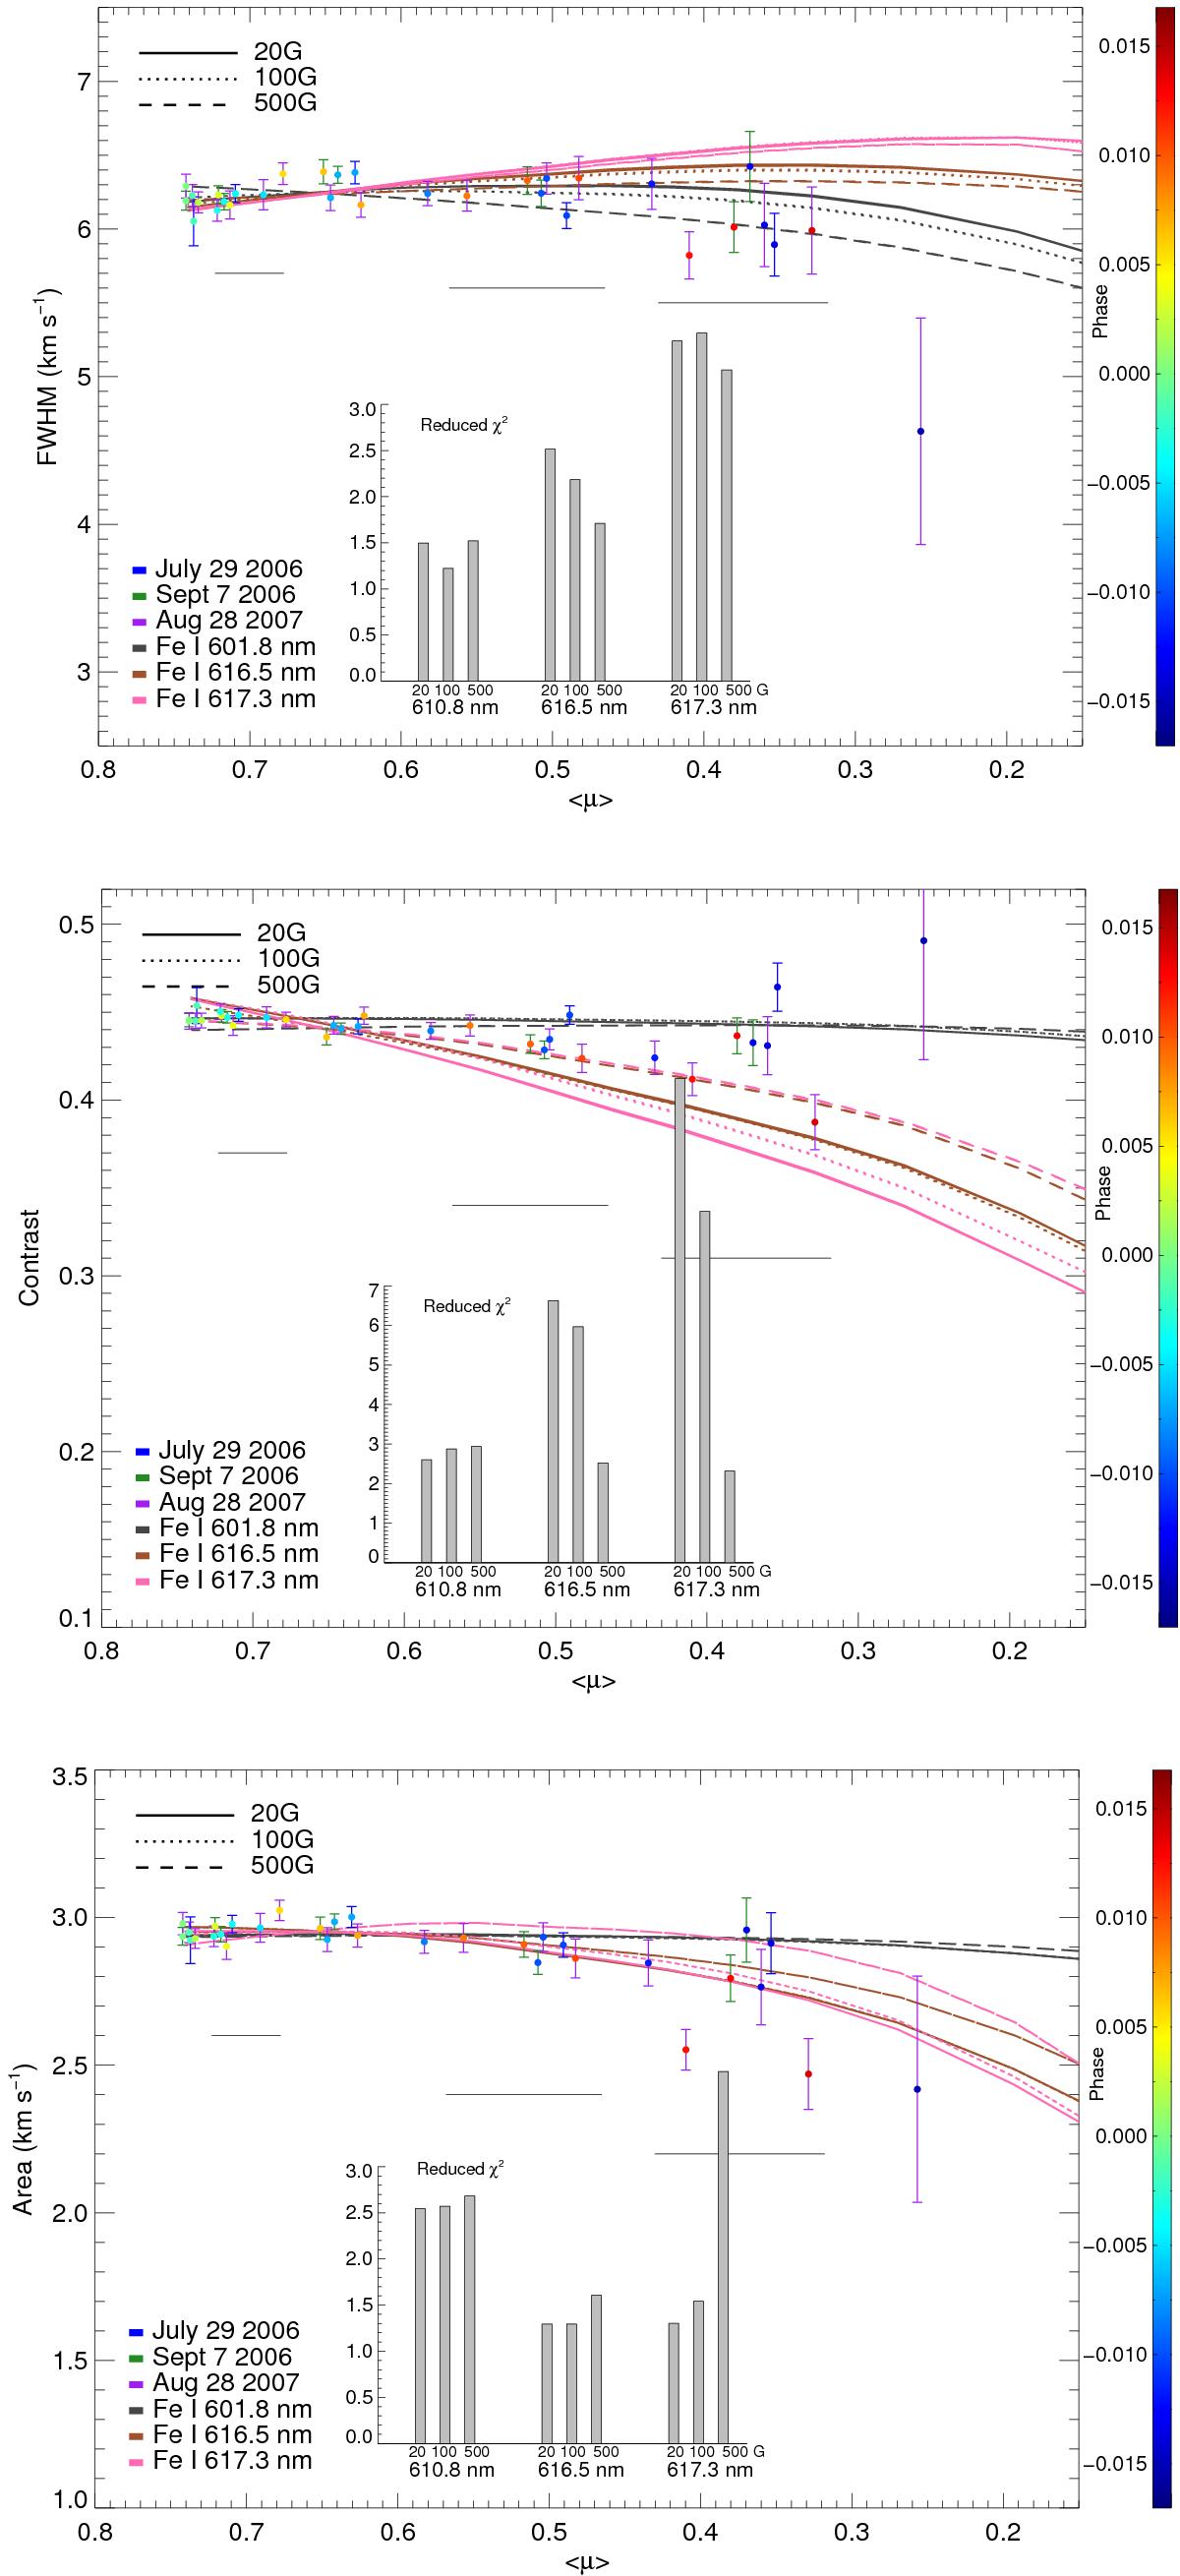
FWHM (Top), contrast (Middle), and area (Bottom) of a Gaussian fit to the residual profiles. The Fe i 610.8 nm, 616.5 nm, and 617.3 nm simulated data are plotted as grey, brown, and pink lines, respectively; line style indicates the average magnetic field strength, with solid, dotted, and dashed lines representing 20, 100, and 500 G simulations, respectively. HD 189733 data are colour-coded by phase, with error bars colour-coded by observation night. Black horizontal bars represent the estimated error on the observed ⟨μ⟩ at different locations. Inset displays the reduced χ2.
Current usage metrics show cumulative count of Article Views (full-text article views including HTML views, PDF and ePub downloads, according to the available data) and Abstracts Views on Vision4Press platform.
Data correspond to usage on the plateform after 2015. The current usage metrics is available 48-96 hours after online publication and is updated daily on week days.
Initial download of the metrics may take a while.