Fig. 6
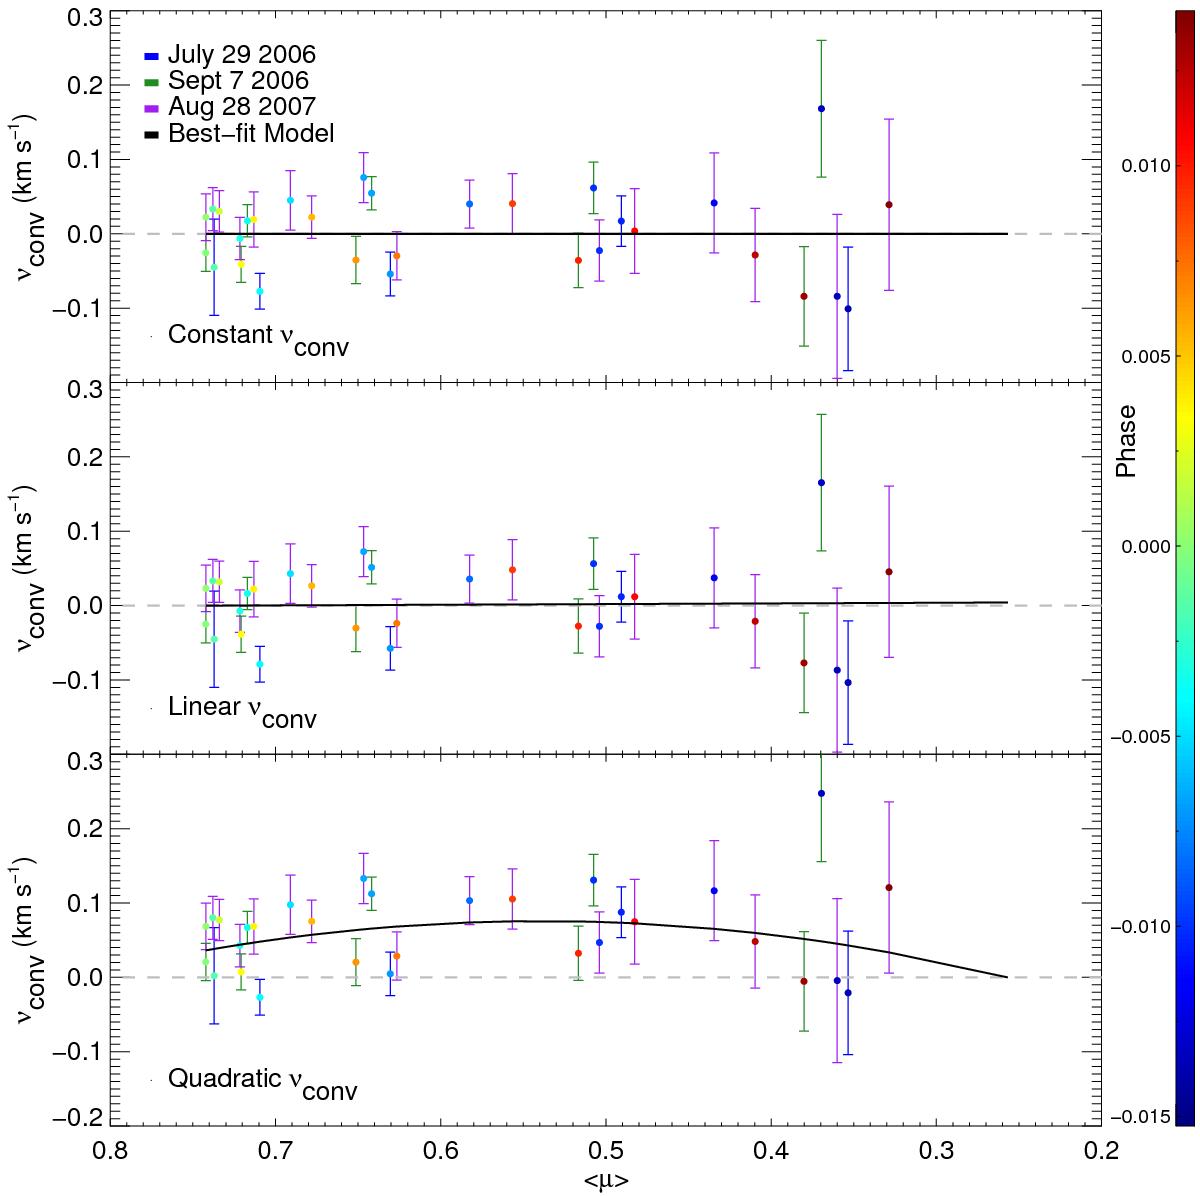
Net convective velocity shifts determined from subtracting the vstel model fits from the local RVs of the in-transit residual CCFs as a function of stellar disc position, defined as the brightness-weighted ⟨μ⟩ behind the planet. Shown for each vconv formulation: constant (top), linear (middle), and quadratic (bottom); note a point at ⟨μ⟩ ≈ 0.26 (and vconv ≈ −0.54−−0.62 km s-1) with large error is not shown in order to better view the remaining points. The colour-coding of the data points indicates the phase, while the colour of the error bar indicates the observation date. Horizontal dashed lines at 0 are shown to guide the eye.
Current usage metrics show cumulative count of Article Views (full-text article views including HTML views, PDF and ePub downloads, according to the available data) and Abstracts Views on Vision4Press platform.
Data correspond to usage on the plateform after 2015. The current usage metrics is available 48-96 hours after online publication and is updated daily on week days.
Initial download of the metrics may take a while.