Fig. 1
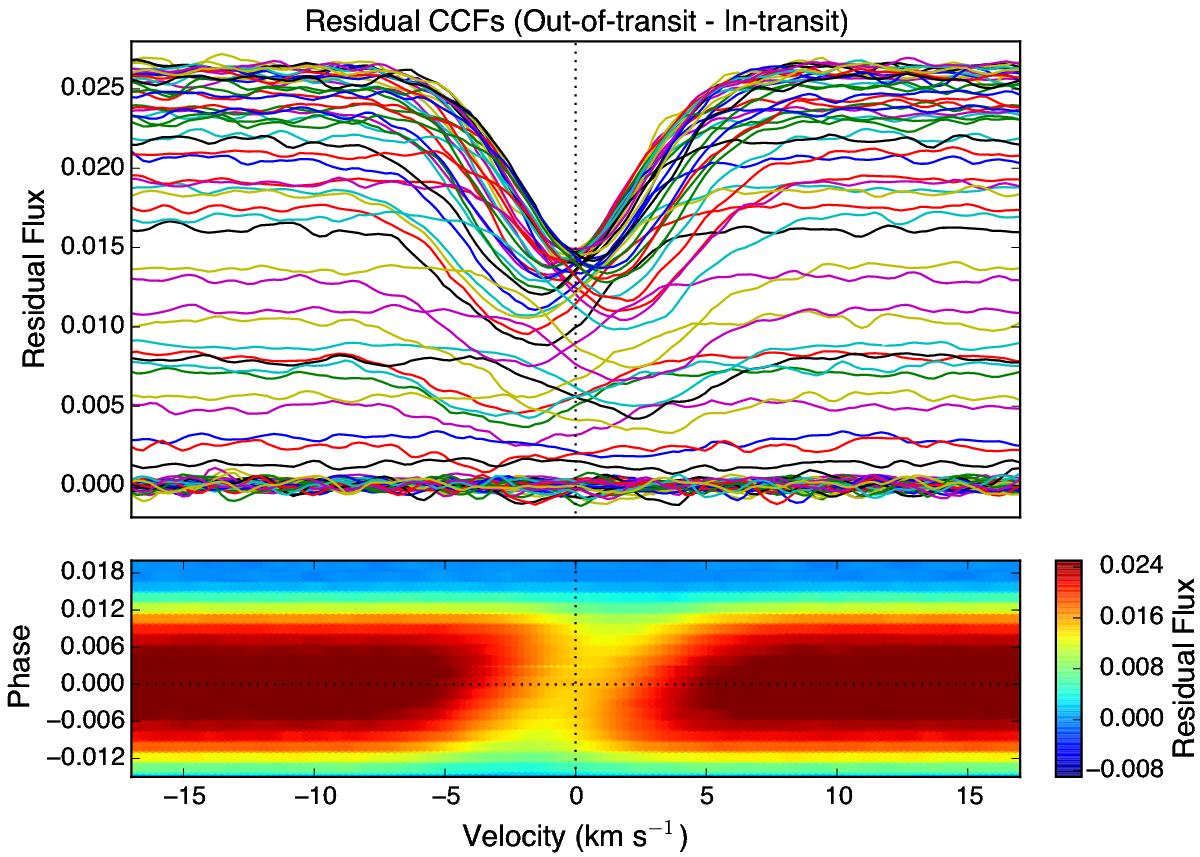
Top: residual CCF profiles; colours chosen for viewing ease. Bottom: residual map of (a subset of) the time series CCFs, colour-coded by residual flux. Dotted lines at 0 phase and 0 km s-1 are shown to guide the eye. The travelling “bump” in the CCFin profiles is evident as a bright streak, as the planet traverses the stellar disc. The transit centre occurs at ~0 km s-1 in both plots because the orbital motion and systemic RVs were removed.
Current usage metrics show cumulative count of Article Views (full-text article views including HTML views, PDF and ePub downloads, according to the available data) and Abstracts Views on Vision4Press platform.
Data correspond to usage on the plateform after 2015. The current usage metrics is available 48-96 hours after online publication and is updated daily on week days.
Initial download of the metrics may take a while.