Fig. 7
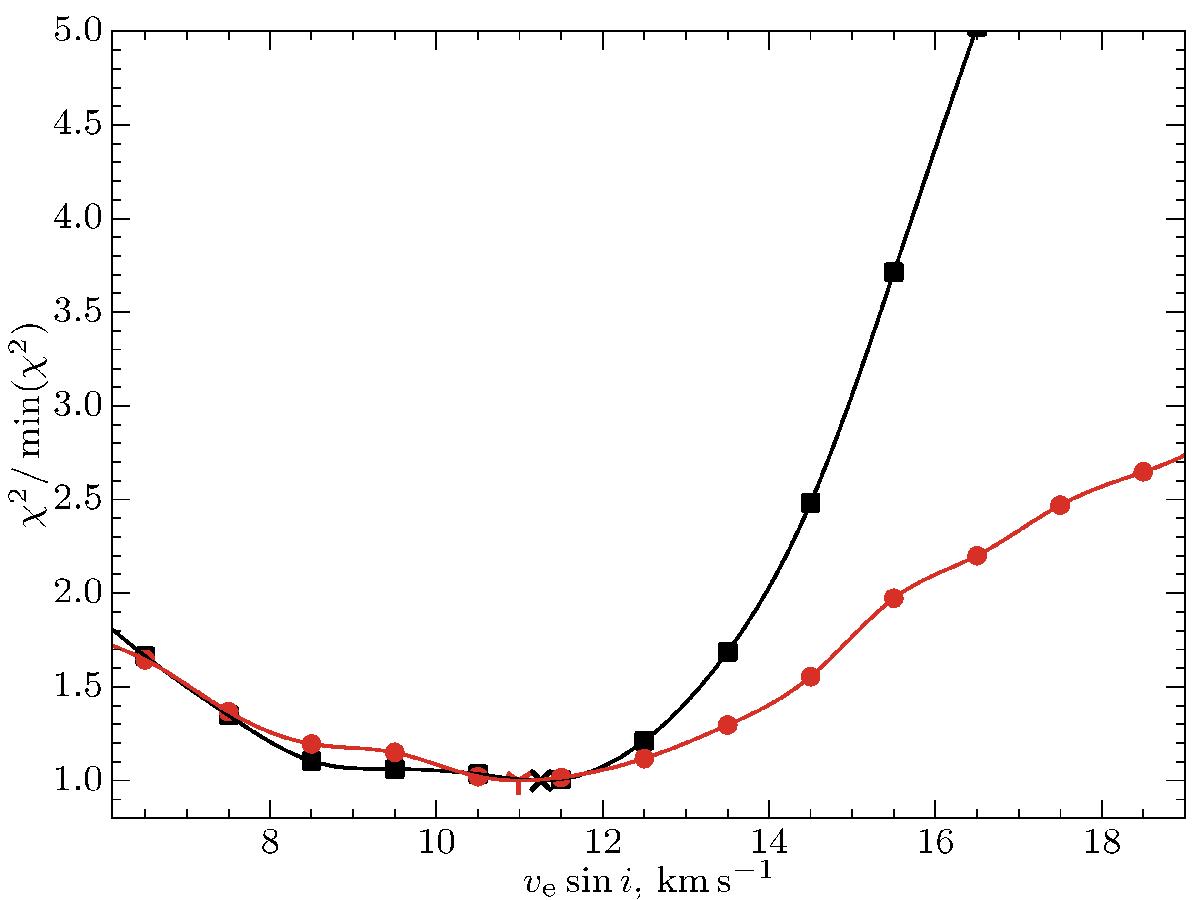
Variation of χ2 of the fit to the Stokes I profiles as a function of the projected rotational velocity. The curve, indicated with squares (black), shows the normalized deviation for the Fe and Cr lines; their minimum is indicated with the × symbol. The curve indicated with bullets (red) shows the same for the rare earth element lines; the minimum is shown with the ʏ symbol. The solid curves are interpolating cubic splines used to find the optimal projected rotational velocity.
Current usage metrics show cumulative count of Article Views (full-text article views including HTML views, PDF and ePub downloads, according to the available data) and Abstracts Views on Vision4Press platform.
Data correspond to usage on the plateform after 2015. The current usage metrics is available 48-96 hours after online publication and is updated daily on week days.
Initial download of the metrics may take a while.