Free Access
Fig. 15
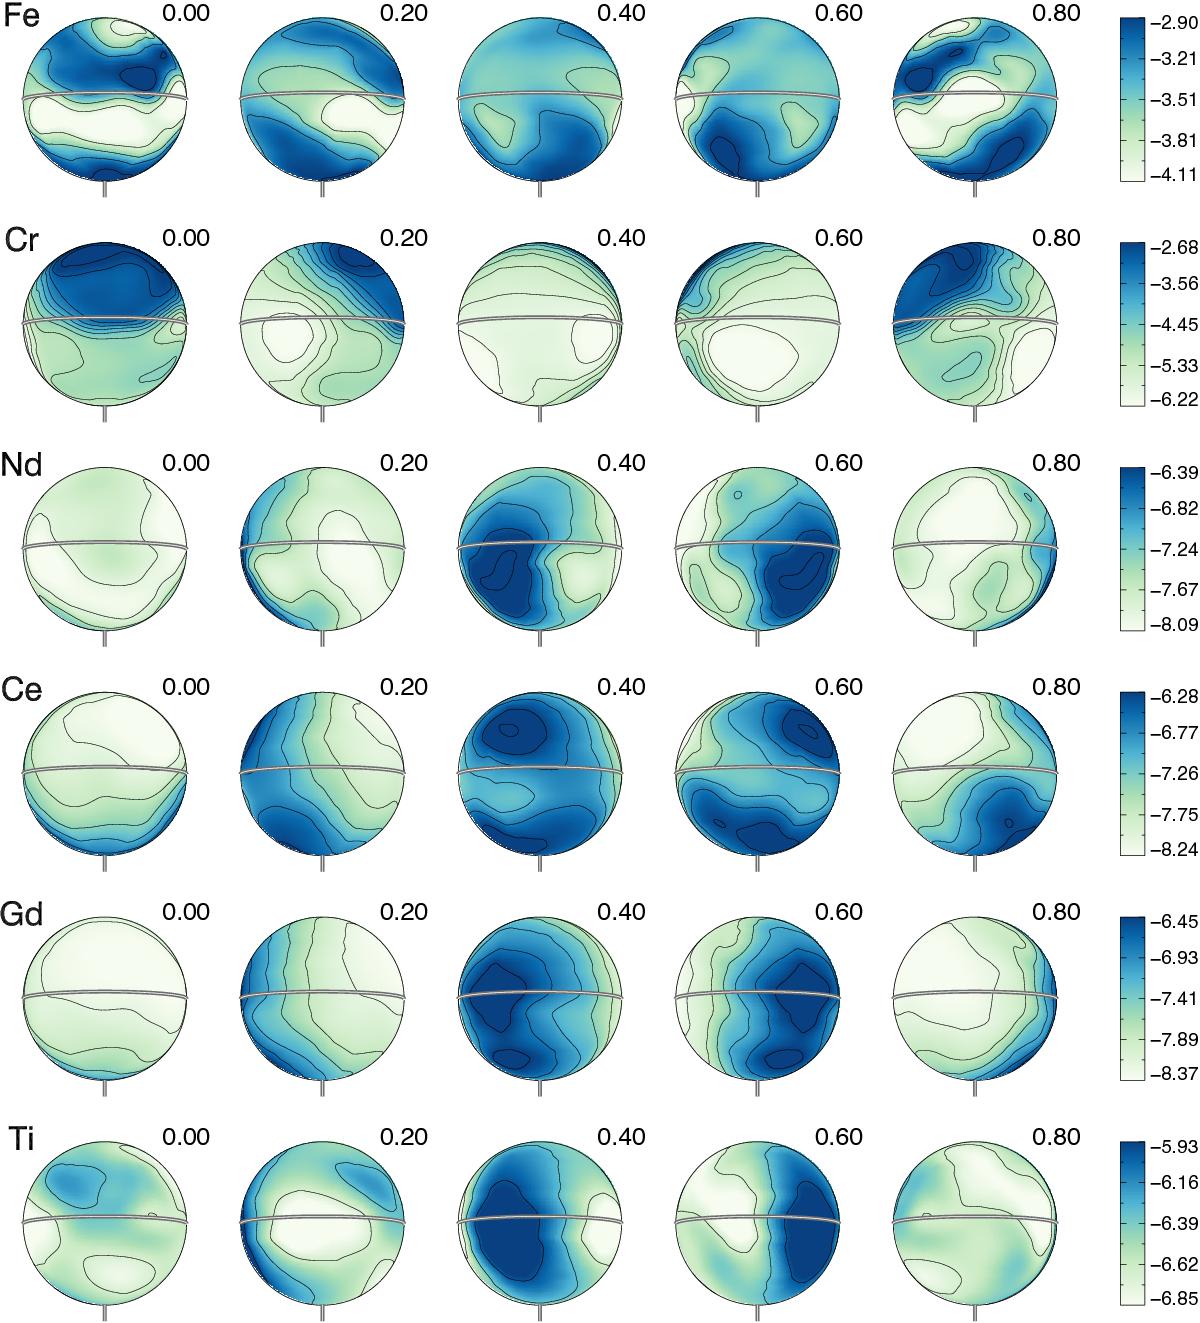
Abundance distributions of Fe, Cr, Nd, Ce, Gd, and Ti on the surface of HD 125248. The color bars on the right indicate the abundance in log (NX/Ntot) units. The contours are plotted with 0.35 dex steps. The thick line and the vertical bar indicate positions of the rotational equator and the pole, respectively.
Current usage metrics show cumulative count of Article Views (full-text article views including HTML views, PDF and ePub downloads, according to the available data) and Abstracts Views on Vision4Press platform.
Data correspond to usage on the plateform after 2015. The current usage metrics is available 48-96 hours after online publication and is updated daily on week days.
Initial download of the metrics may take a while.