Fig. 1
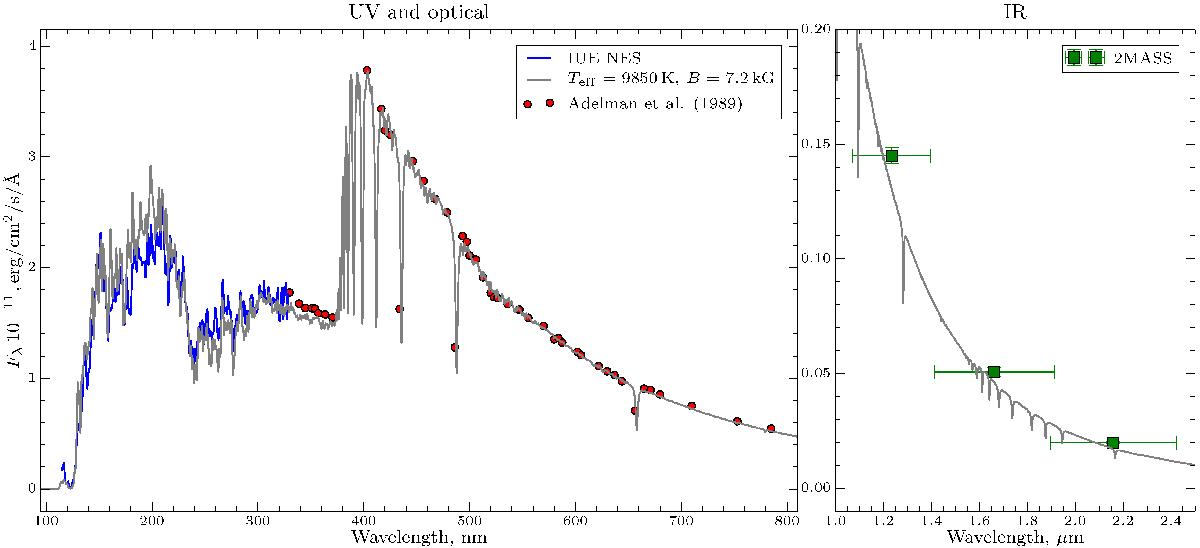
Comparison between the theoretical and observed spectrophotometry of HD 125248. The light gray curve shows the spectral energy distribution computed using a model atmosphere with Teff = 9850 K, log g = 4.05, including the effects of individual nonsolar abundances of HD 125248 and a magnetic field with strength ⟨ B ⟩ = 7200 G. The observations cover the UV (blue lines), optical (red circles) and near-IR (green squares) spectral regions.
Current usage metrics show cumulative count of Article Views (full-text article views including HTML views, PDF and ePub downloads, according to the available data) and Abstracts Views on Vision4Press platform.
Data correspond to usage on the plateform after 2015. The current usage metrics is available 48-96 hours after online publication and is updated daily on week days.
Initial download of the metrics may take a while.