Fig. 7
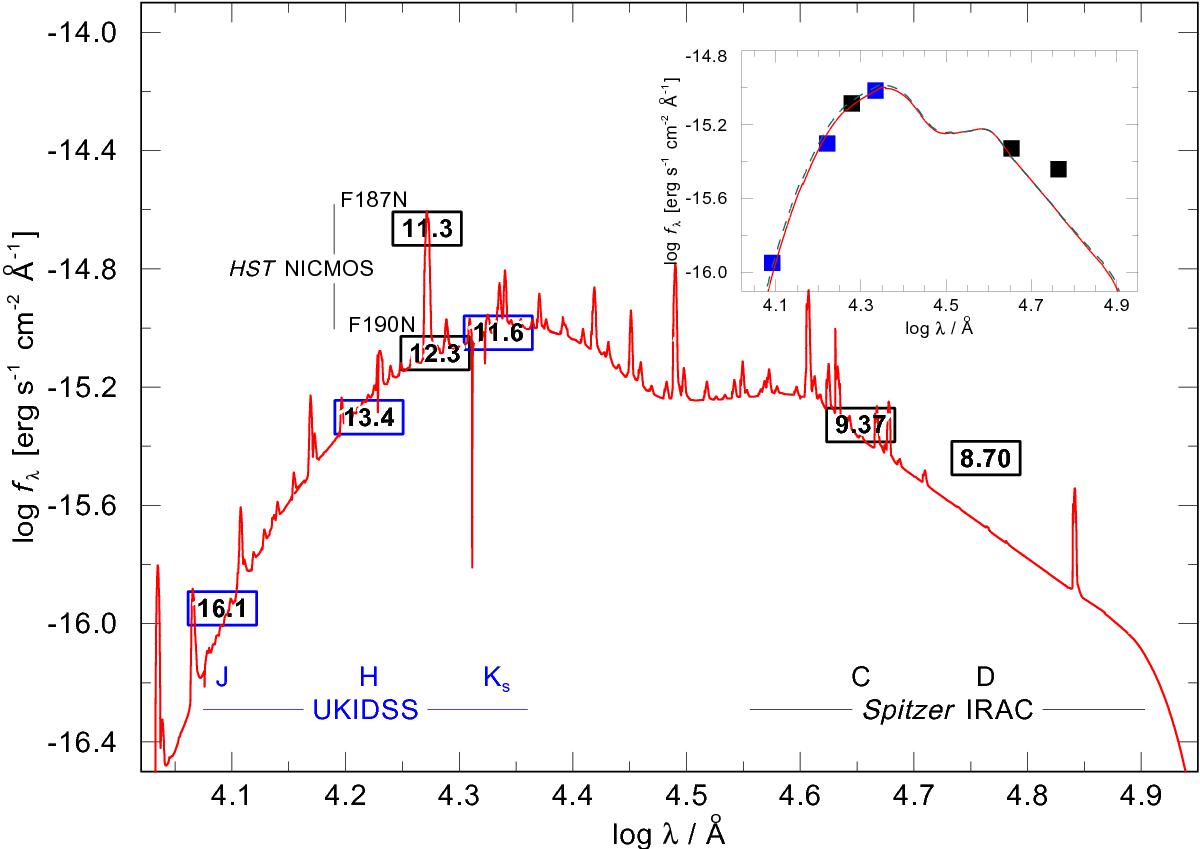
Spectral energy distribution for WR 102c. The reddened spectrum of the PoWR model with T∗ = 75 kK is shown as a red solid line (see Table 3 for the detailed parameters) and compared to the available photometry, which is indicated by blue (UKIDSS) and black (HST NICMOS Paα filters and Spitzer IRAC Channels 2 and 3) boxes. The inset in the upper right corner shows the continuum photometry marks compared to the continuum SED for the two alternative models used in Fig. 6 with T∗ = 66 kK (green dashed curve) and 75 kK (red solid curve), respectively. The overall SED fit is hardly affected by the temperature uncertainty. We note that in the mid-IR the stellar SED is below the photometric observation, attributed to the emission from a warm dusty nebula (Barniske et al. 2008).
Current usage metrics show cumulative count of Article Views (full-text article views including HTML views, PDF and ePub downloads, according to the available data) and Abstracts Views on Vision4Press platform.
Data correspond to usage on the plateform after 2015. The current usage metrics is available 48-96 hours after online publication and is updated daily on week days.
Initial download of the metrics may take a while.