Fig. 10
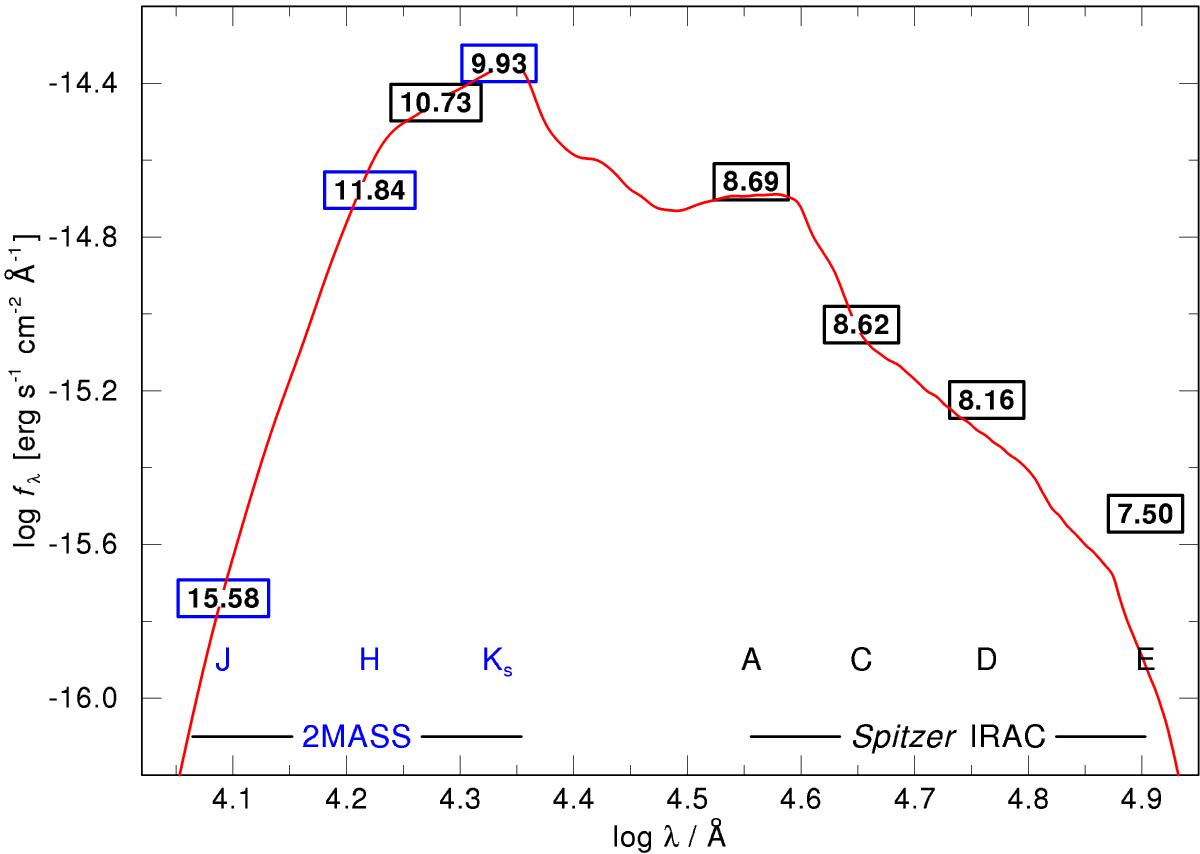
Spectral energy distribution (SED) of star 10 (MSX6C G000.1668-00.0434) fitted by a MARCS model (red curve) with T∗ = 3.3 kK, log L/L⊙ = 3.65, and log g = 1.0. The boxes represent photometry from 2MASS J, H, and K (blue, labels = magnitudes), HST NICMOS F190N (black), and Spitzer IRAC (black) in the mid-IR. The model is reddened with an extinction of EB−V = 8.3 mag.
Current usage metrics show cumulative count of Article Views (full-text article views including HTML views, PDF and ePub downloads, according to the available data) and Abstracts Views on Vision4Press platform.
Data correspond to usage on the plateform after 2015. The current usage metrics is available 48-96 hours after online publication and is updated daily on week days.
Initial download of the metrics may take a while.