Fig. 7
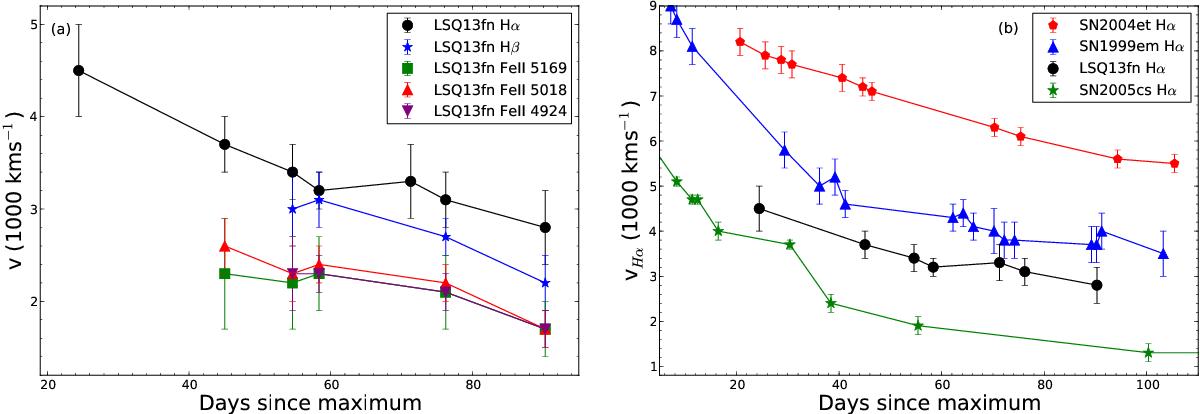
Panel a): comparison of the expansion velocities of various lines of LSQ13fn as measured from their P Cygni absorption minima. The uncertainties were estimated by repeating the measurement of the absorption minimum several times across slightly different wavelength ranges. Panel b): comparison of the expansion velocities of LSQ13fn and other SNe II as measured from the P Cygni absorption minima of Hα.
Current usage metrics show cumulative count of Article Views (full-text article views including HTML views, PDF and ePub downloads, according to the available data) and Abstracts Views on Vision4Press platform.
Data correspond to usage on the plateform after 2015. The current usage metrics is available 48-96 hours after online publication and is updated daily on week days.
Initial download of the metrics may take a while.