Fig. 4
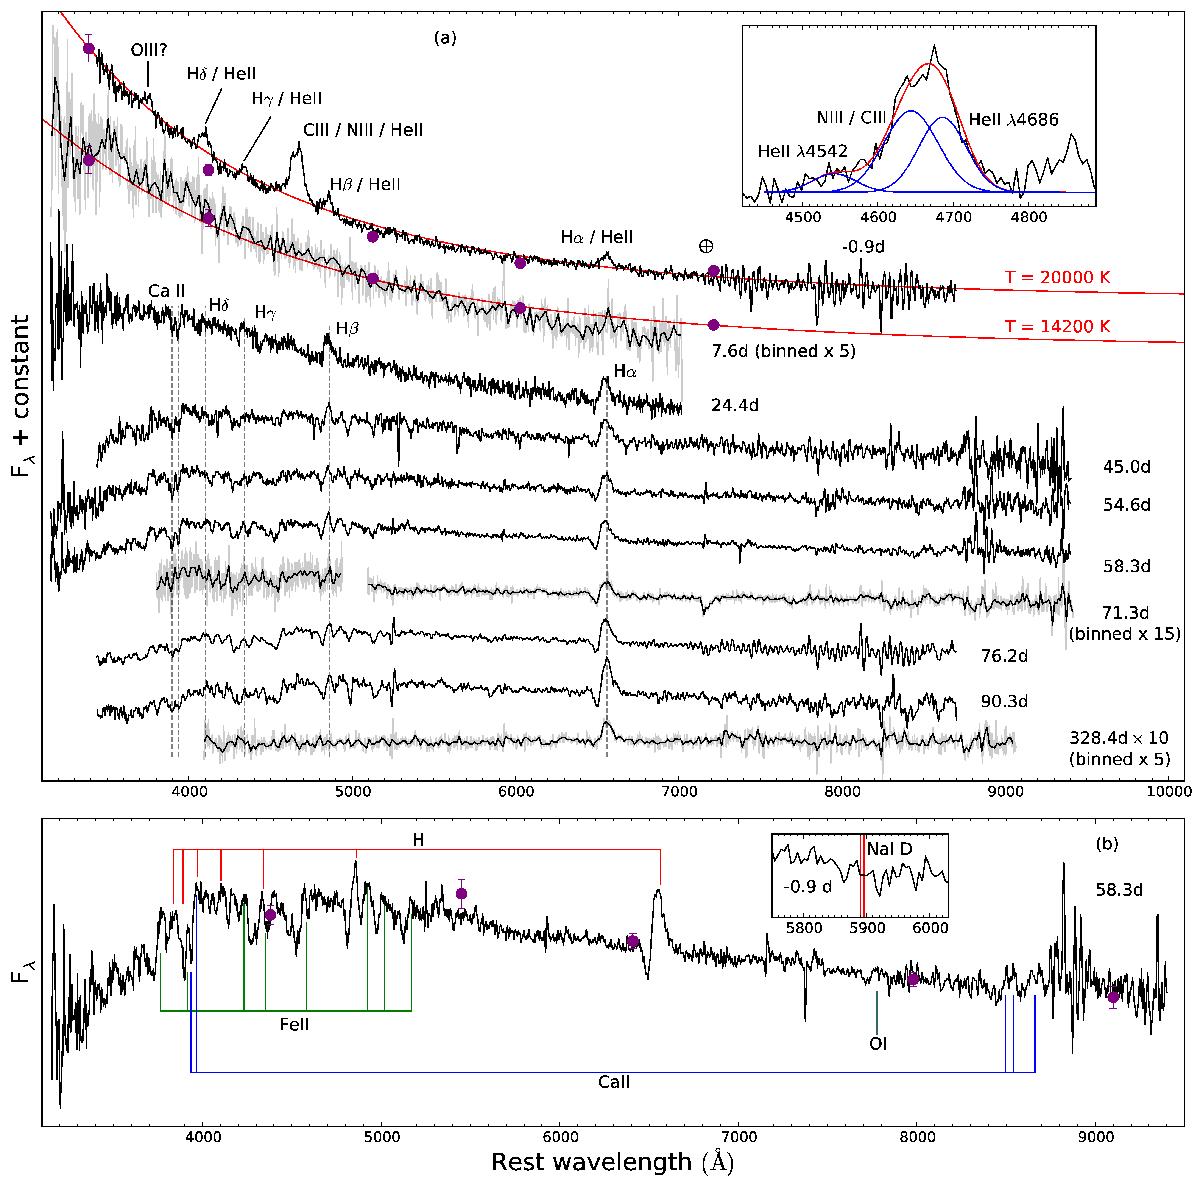
Panel a): sequence of optical spectra of LSQ13fn. The spectra have been corrected for reddening and redshift of the host galaxy. The epochs are in the rest frame of the SN. The 7.6 d, 71.3 d and 328.4 d spectra are shown in light grey, with binned versions in black. The ⊕ symbol indicates the position of significant telluric absorption. The red curves are blackbody fits to the UBVRi photometry at coeval epochs (the purple points) for the −0.9 d and 7.6 d spectra. The inset shows a fit of three Gaussian profiles to the He ii / C iii / N iii feature of the continuum subtracted spectrum of LSQ13fn at −0.9 d. Panel b): the spectrum of 58.3 d with the strongest lines identified. The purple points show the BVRIz photometry from a nearly coeval epoch. The inset shows a zoom-in of the −0.9 d spectrum in the region of Na i D with the rest wavelengths (λλ5890, 5896) marked by vertical red lines.
Current usage metrics show cumulative count of Article Views (full-text article views including HTML views, PDF and ePub downloads, according to the available data) and Abstracts Views on Vision4Press platform.
Data correspond to usage on the plateform after 2015. The current usage metrics is available 48-96 hours after online publication and is updated daily on week days.
Initial download of the metrics may take a while.