Fig. 10
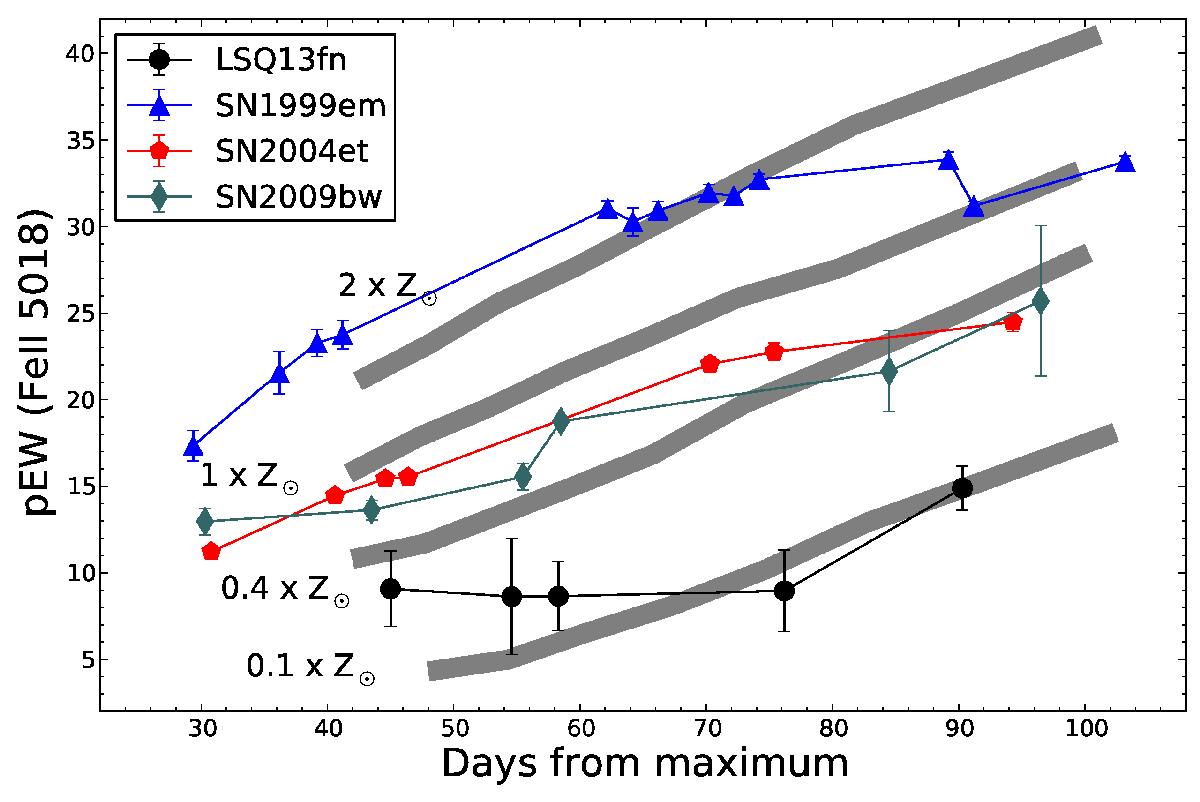
Measurements of the pEW of the Fe ii λ5018 line in the spectra of LSQ13fn and comparison SNe IIP. The thick grey lines show measurements from the model spectra of Dessart et al. (2014). The epochs of the model spectra, originally referring to the number of days after explosion, have been shifted to the number of days after maximum light assuming a rise time of 7 d (see Sect. 4.4 for a justification of this choice). We note that oxygen abundance of nearby H ii regions have previously been measured for the comparison SNe shown in the figure: 12 + log (O/H) ~ 8.6, 8.3, and 8.66 for SN 1999em (Smartt et al. 2009), SN 2004et (Smartt et al. 2009), and SN 2009bw (Inserra et al. 2012) respectively. Assuming a solar abundance of 12 + log (O/H) = 8.69 (Asplund et al. 2009), these correspond to approximately 0.8 Z⊙, 0.4 Z⊙, and 0.9 Z⊙ respectively for SN 1999em, SN 2004et, and SN 2009bw.
Current usage metrics show cumulative count of Article Views (full-text article views including HTML views, PDF and ePub downloads, according to the available data) and Abstracts Views on Vision4Press platform.
Data correspond to usage on the plateform after 2015. The current usage metrics is available 48-96 hours after online publication and is updated daily on week days.
Initial download of the metrics may take a while.