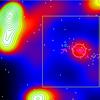
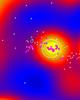
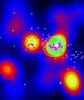
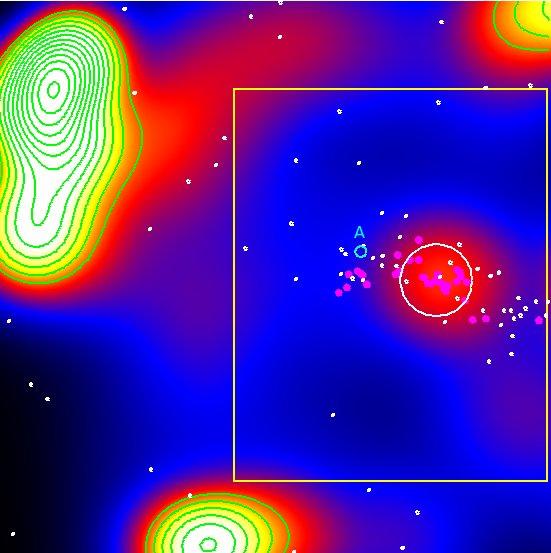
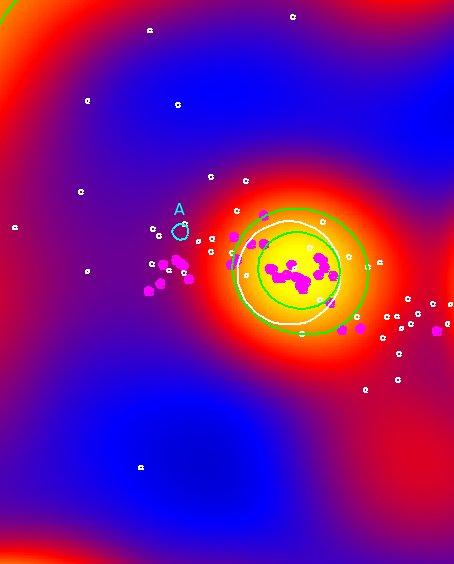
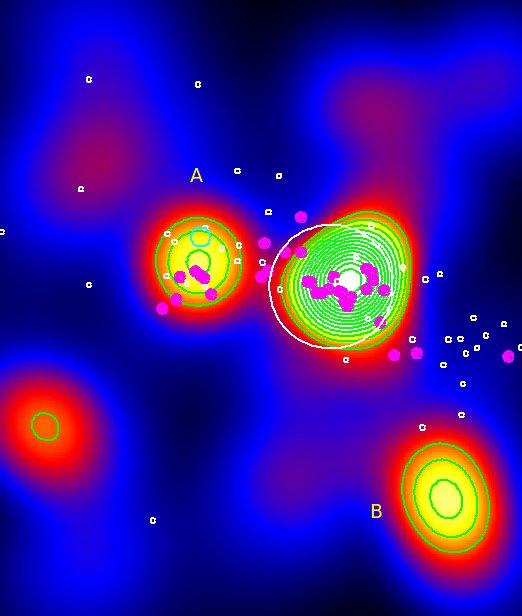
Fig. B.1

Same as Fig. 3 for BMW-HRI J122657.3+333253 (z = 0.8900). Top figure: density map for the entire Subaru/SuprimeCam field with the yellow rectangle indicating the subregion considered in the two figures just below. Middle figure: subimage extracted (within the yellow rectangle) from the initial density map with contour levels recalculated, based on the background of this new subimage. The bottom image was computed after extracting from the initial catalogue of cluster galaxies the galaxies belonging to the yellow rectangle and recomputing the density map. See text for more explanations. The magenta points correspond to the galaxies with spectroscopic redshifts in the 0.87 <z< 0.92 interval.
Current usage metrics show cumulative count of Article Views (full-text article views including HTML views, PDF and ePub downloads, according to the available data) and Abstracts Views on Vision4Press platform.
Data correspond to usage on the plateform after 2015. The current usage metrics is available 48-96 hours after online publication and is updated daily on week days.
Initial download of the metrics may take a while.