Fig. 2
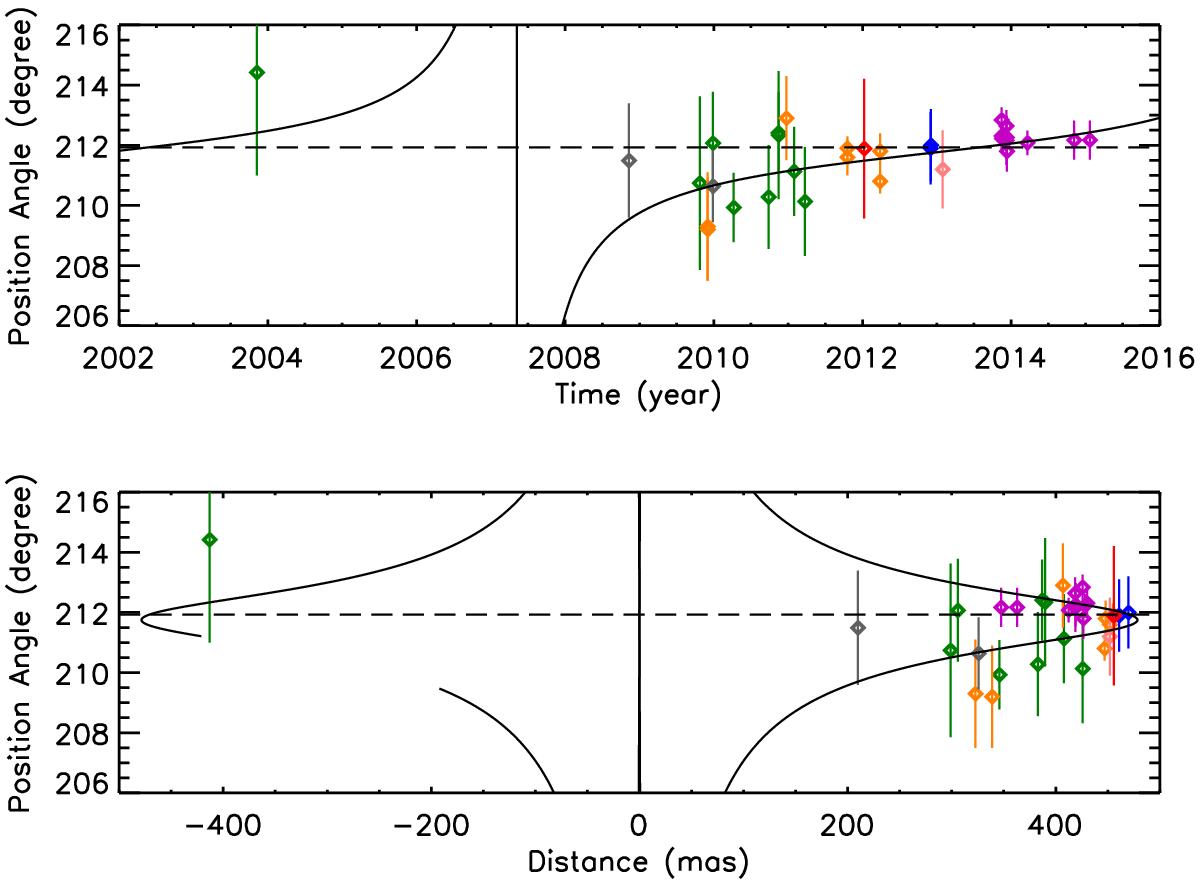
Measured position angle of β Pic b as a function of time and as a function of the distance to the star. Vertical bars represent 1σ error bars. The colors of the symbols are the same as in Fig. 1. The gray point is the single measurement of Currie et al. (2011), which was obtained very early at a low projected distance; given its uncertainty, it does not discriminate between the two scenarios, unlike the measurements of MB15 (purple). The model with an orbit inclination of 89° (solid line) fits the data more closely than an inclination of 90° (constant value of PA obtained by weighted mean of the data, dashed line).
Current usage metrics show cumulative count of Article Views (full-text article views including HTML views, PDF and ePub downloads, according to the available data) and Abstracts Views on Vision4Press platform.
Data correspond to usage on the plateform after 2015. The current usage metrics is available 48-96 hours after online publication and is updated daily on week days.
Initial download of the metrics may take a while.