Fig. 16
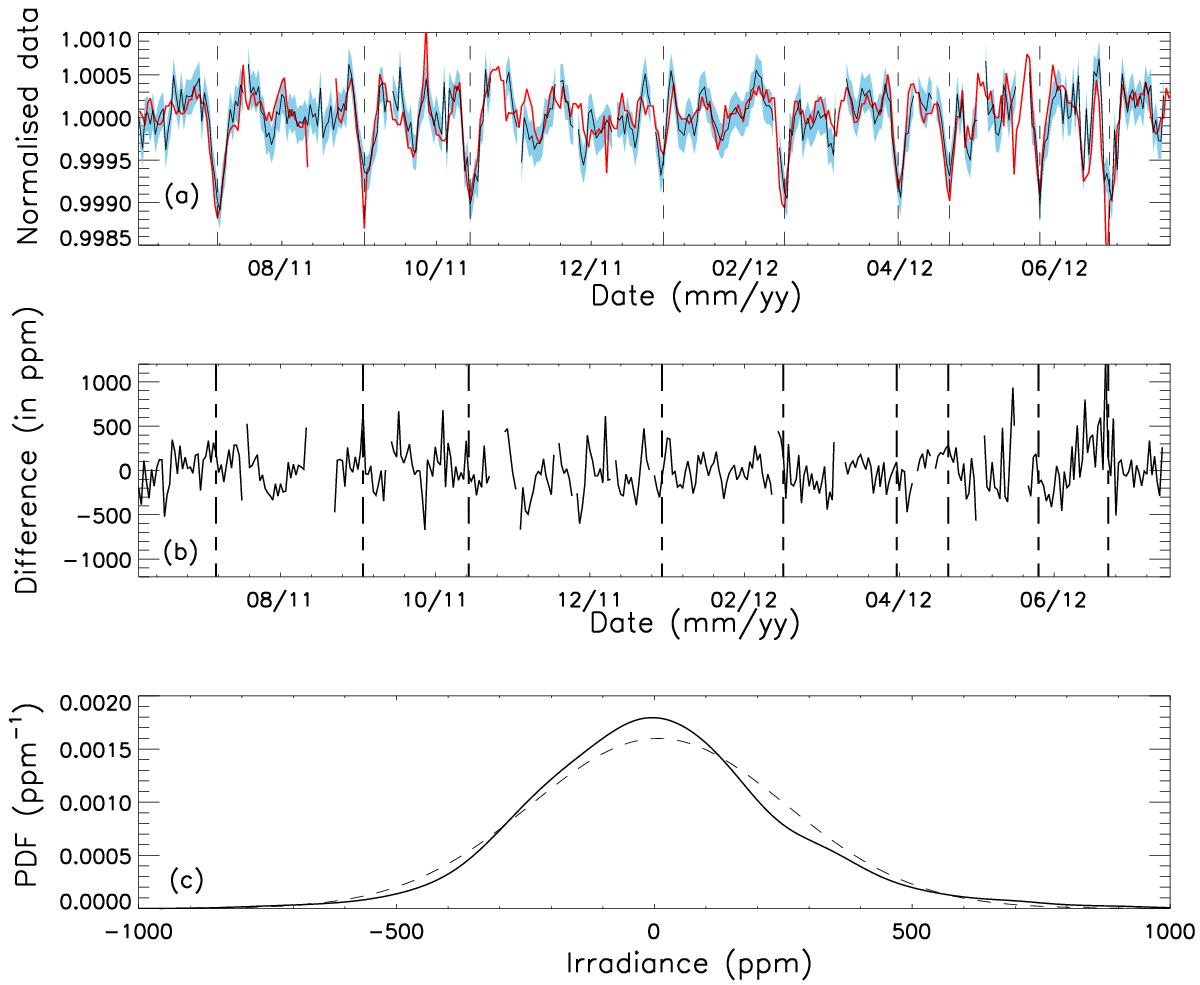
Short-term variability of the irradiance at 535 nm as observed by PREMOS (in black) and by SORCE (in red) from July 2011 to July 2012 (panel a)). The difference (in ppm) between PREMOS and SORCE is also plotted (panel b)) for the corresponding period. Thin vertical lines indicate the passage of a sunspot. Panel c) shows the probability density function (PDF) of the difference between both instruments (solid line) along with the respective Gaussian fit (dashed line).
Current usage metrics show cumulative count of Article Views (full-text article views including HTML views, PDF and ePub downloads, according to the available data) and Abstracts Views on Vision4Press platform.
Data correspond to usage on the plateform after 2015. The current usage metrics is available 48-96 hours after online publication and is updated daily on week days.
Initial download of the metrics may take a while.