Free Access
Fig. 12
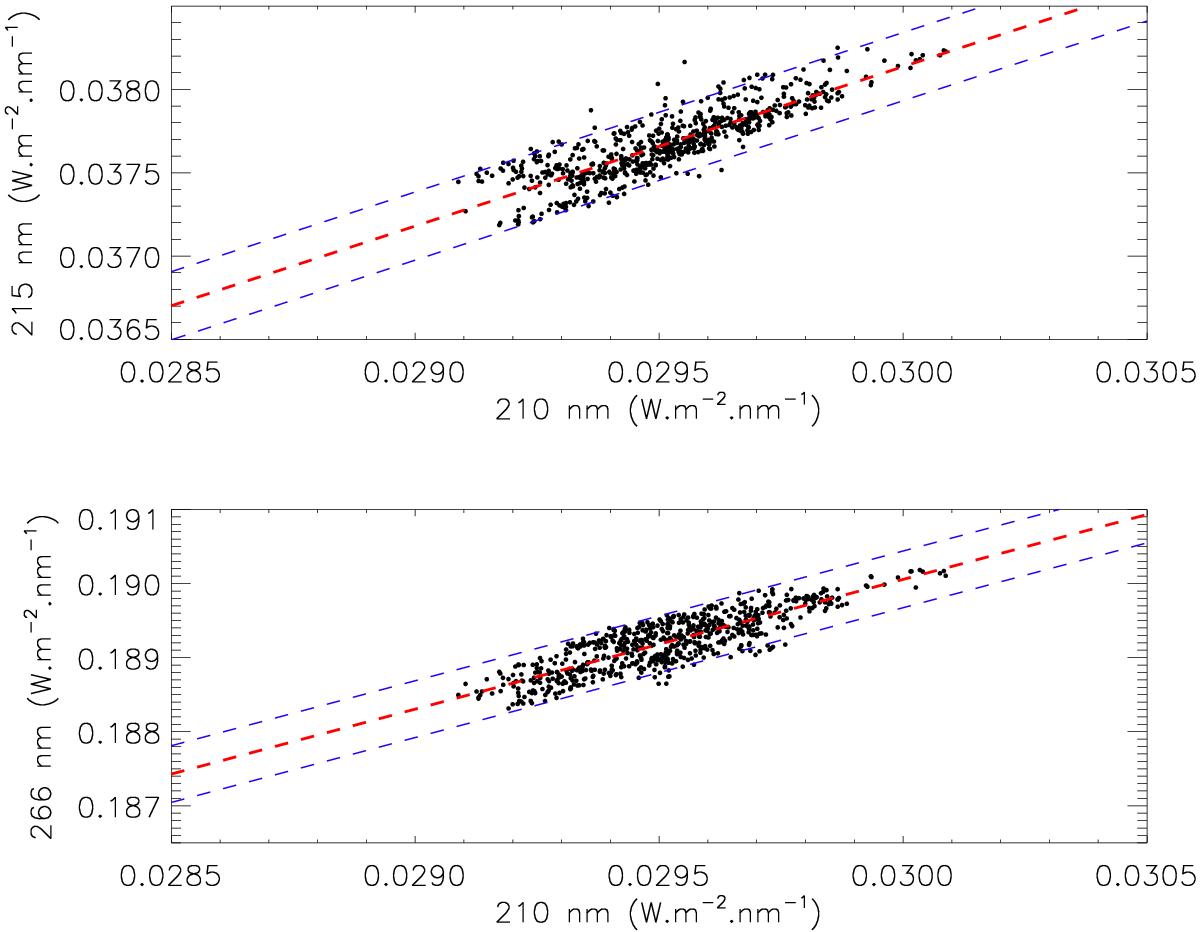
Irradiance at 215 nm plotted against the irradiance at 210 nm (top figure), and irradiance at 266 nm plotted against the irradiance at 210 nm (lower figure). The regression lines are shown (red dotted lines), as well as the 2σ intervals (blue dotted lines).
Current usage metrics show cumulative count of Article Views (full-text article views including HTML views, PDF and ePub downloads, according to the available data) and Abstracts Views on Vision4Press platform.
Data correspond to usage on the plateform after 2015. The current usage metrics is available 48-96 hours after online publication and is updated daily on week days.
Initial download of the metrics may take a while.