Fig. 5
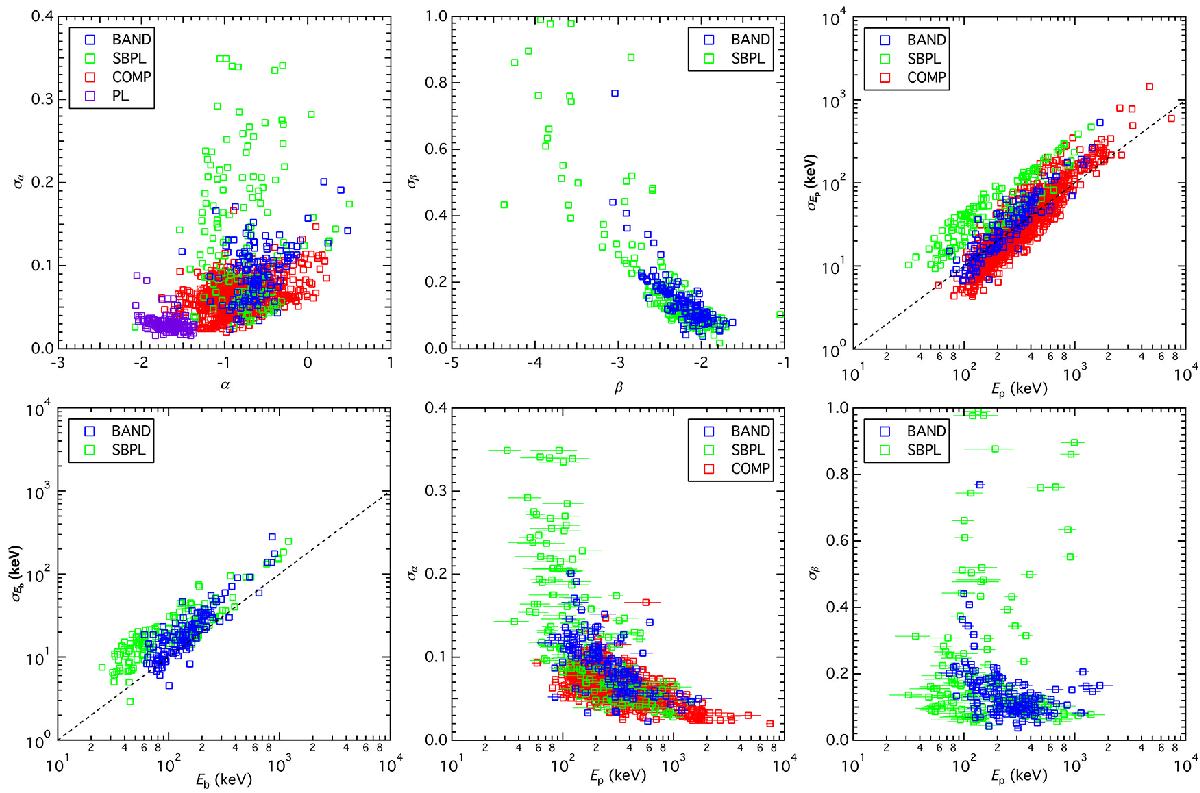
Scatter plots between the BEST sample spectral parameters and uncertainties. The blue, red, green, and purple data points represent BAND, COMP, SBPL, and PL fits, respectively. The dashed lines show y = 0.1x. Top left panel: σα against α. Top middle panel: σβ against β. Top right panel: σEp against Ep. Bottom left panel: σEb against Eb. Bottom middle panel: σα against Ep. Bottom right panel: σβ against Ep.
Current usage metrics show cumulative count of Article Views (full-text article views including HTML views, PDF and ePub downloads, according to the available data) and Abstracts Views on Vision4Press platform.
Data correspond to usage on the plateform after 2015. The current usage metrics is available 48-96 hours after online publication and is updated daily on week days.
Initial download of the metrics may take a while.