Fig. D.1
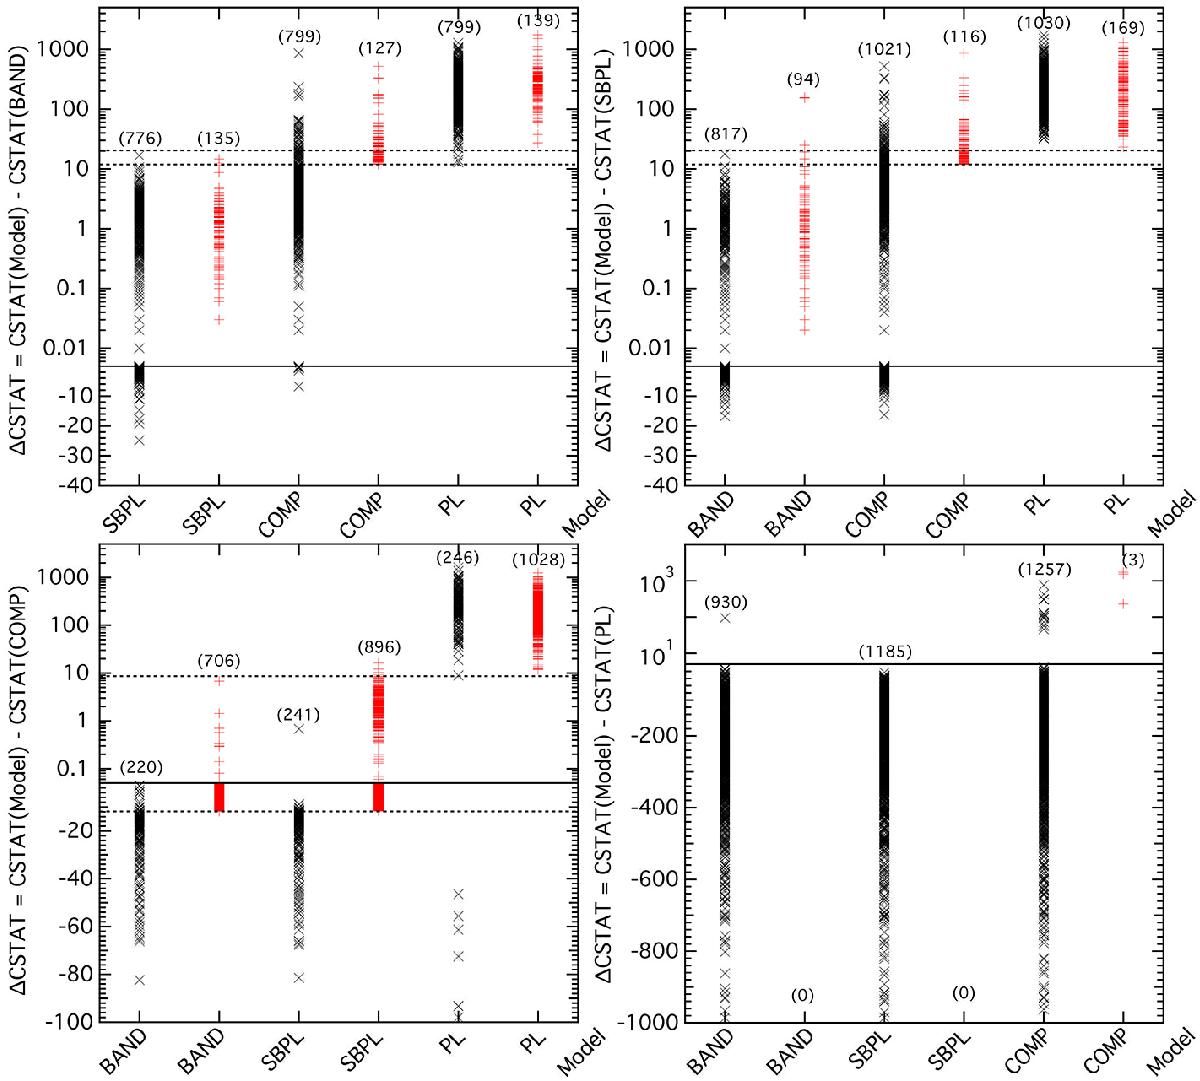
Difference between the CSTAT values for every pair of GOOD fits from each spectrum. The top left, top right, bottom left, and bottom right panels show the CSTAT differences, ΔCSTAT, between the other models and BAND, SBPL, COMP, and PL, respectively. Red crosses indicate the latter model in the subtraction is the BEST model (i.e., also a GOOD model), and black crosses indicate the latter model in the subtraction is the GOOD-but-not-BEST model. The numbers in brackets indicate the number of pairs of models compared (those spectra with only one GOOD and/or BEST fits were not compared). The two dashed lines indicate 11.83 and 11.83 + 8.58 = 20.41 in the top panels and −11.83 and 8.58 in the bottom left panel. The solid line separates the logarithmic positive y-axis and linear negative y-axis. One black cross for CSTAT(PL) − CSTAT(BAND) = −95, about 20 black crosses for CSTAT(SBPL) − CSTAT(COMP) and CSTAT(PL) − CSTAT(COMP) down to ~–1700, and about 20 black crosses for CSTAT(Model) − CSTAT(PL) down to ~–6800 are not shown for clear display purposes.
Current usage metrics show cumulative count of Article Views (full-text article views including HTML views, PDF and ePub downloads, according to the available data) and Abstracts Views on Vision4Press platform.
Data correspond to usage on the plateform after 2015. The current usage metrics is available 48-96 hours after online publication and is updated daily on week days.
Initial download of the metrics may take a while.